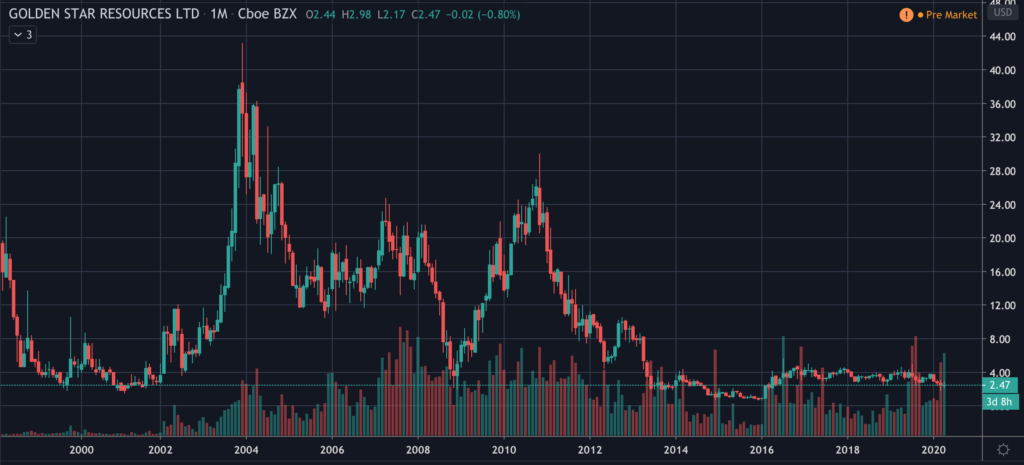
GSS Stock: Golden Star Resources (GSS)
Current Market Price: $2.47
Market Capitalization: $270.8 million
GSS Stock – Summary of the Company
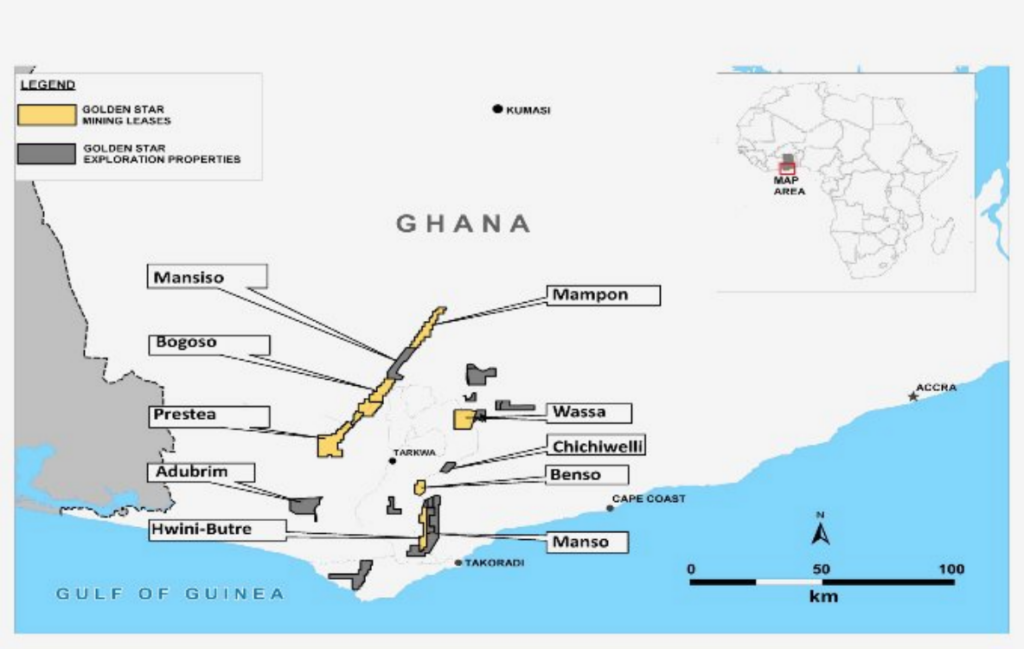
Golden Star Resources is a gold mining company with 2 producing mines in Ghana, the Wassa mine and the Prestea mine. Both mines are open pit mines. The company also owns several exploration stage projects in Ghana and Brazil. Golden Star Resources was founded in 1992 and is headquartered in Toronto, Canada. They have over 1,300 employees.
GSS Stock – Revenue and Sales Analysis
Both of the company’s mines produce significant revenue. In 2019 total revenue was $264 million, a slight decrease from $ 273 million in 2018. They had a net loss in both years of $78 million and $24 million respectively.
In 2019 they produced 203,769 ounces of gold, down slightly from 224,784 ounces in 2018. Roughly 90% of their production is sold through a South African gold refinery.
Royalty and Streaming Agreements
The government of Ghana receives a 5% royalty from both of the companies producing mines. The company also sold net smelter royalties on several of its exploration stage projects.
Golden Star Resources has a streaming agreement in place with Royal Gold (RGLD). Several milestones have already been met and currently the agreement requires Golden Star to sell 5.5% of its production to Royal Gold at 30% of the spot price.
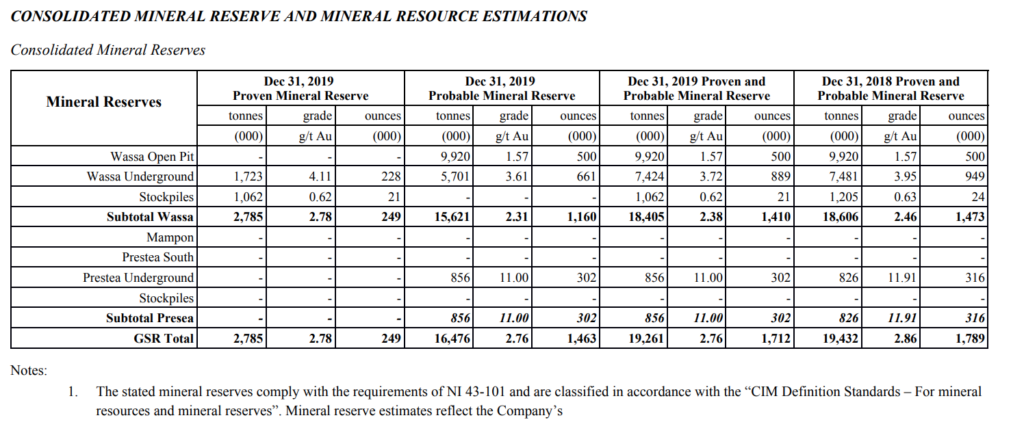
Gold Reserves
The company had an estimated 1,712,000 ounces of “proven and probable” mineral reserves as of year-end 2019. This is down slightly from 1,789,000 and year end 2018.
GSS Stock – Balance Sheet Analysis
Golden Star Resources has a weak balance sheet, with low liquidity. At year end 2019, the company had only $53 million in cash and $107 million in current assets, $38 million of which was inventory.
Current liabilities were $123 million and total liabilities were $406 million. After accounting for non-controlling interests, shareholder equity was negative $32 million at year end 2019.
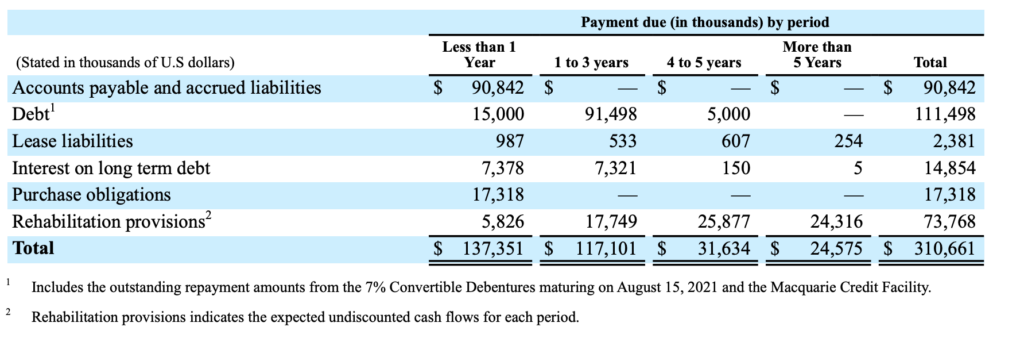
Golden Star Resources – Debt Analysis
Golden Star Resources has high levels of debt including a convertible note due in August of 2021. Given the company’s poor operating results, they may need to seek out additional debt to finance its operations.
GSS Stock – Share Dynamics and Capital Structure
Golden Star Resources had 109 million shares outstanding at year end 2019. The company has significant dilutive instruments outstanding, such as options, share based compensation, and convertible debt.
Potential dilution is a risk for common stock investors in GSS. Investors should carefully consider their place in the capital structure before investing.
GSS Stock – Dividends
Golden Star Resources stock has never paid a dividend to common shareholders. They are likely to continue to retain any earnings and reinvest them in their development stage projects. A dividend to common shareholders is not likely in the near to medium term.
Economic Factors and Competitive Landscape
Gold mining is a highly competitive, capital intensive business. The company will need to compete fiercely for both new projects and capital. However, given the current economic environment of global money printing and zero or negative interest rates, it would appear gold companies are poised to benefit from a strong economic tailwind.
Management Structure – Skin in the game
Insiders at Golden Star Resources have been net buyers of the common stock over the last 12-18 months. This includes a large purchase by the company’s president.
Insider buying is usually viewed as a good signal for the company and the stock.
GSS Stock – 3 Metrics to Consider
Cash Coverage
Cash/Current Liabilities
$53 million/$123 million=.43
A cash coverage ratio of .43 indicates poor short term liquidity and potential financing problems.
Working Capital Ratio
Current Assets/Current Liabilities
$107 million/$123 million= .86
A working capital ratio of .86 indicates that the company has more current liabilities than assets. This means the company may have liquidity issues and problems financing its operations in the near term.
Debt to Equity Ratio
Total Liabilities/ Total Share Holder Equity
$406 million/-$32 million = -12.6
A negative debt to equity ratio is concerning as it indicates high liability levels, financing issues, and a negative return on investment.
GSS Stock – Summary and Conclusions
Golden Star Resources stock is a high-risk investment. The company has highly concentrated revenues coming from only 2 producing mines, in 1 high risk jurisdiction, Ghana. The company has already sold off a significant portion of its current and future production in the form of royalty’s and streaming agreements.
Operating performance has been poor, the company is running a loss and is not likely to be profitable in the near term. Liquidity is low and working capital is constrained. Furthermore, debt levels are high and given the company’s poor operating performance and low liquidity, debt levels are likely to increase.
Finally, Golden Star Resources has a highly dilutive capital structure that is not ideal for common shareholders.
In Summary, GSS common stock investors are poorly positioned within the capital structure of a poorly performing operation. Investors should carefully consider the risks discussed above and perform a through due diligence before making an investment.
Disclaimer
This is not investment advice. Nothing in this analysis should be construed as a recommendation to buy, sell, or otherwise take action related to the security discussed. If I own a position in the security discussed, I will clearly state it.
This is not intended to be a comprehensive analysis and you should not make an investment decision based solely on the information in this analysis. I hope this serves as a useful starting point for a more comprehensive analysis, and hopefully draws attention to aspects of the company that were overlooked or merit further investigation. This is by no means intended to be a complete analysis. Again, this is not investment advice, do your own research.