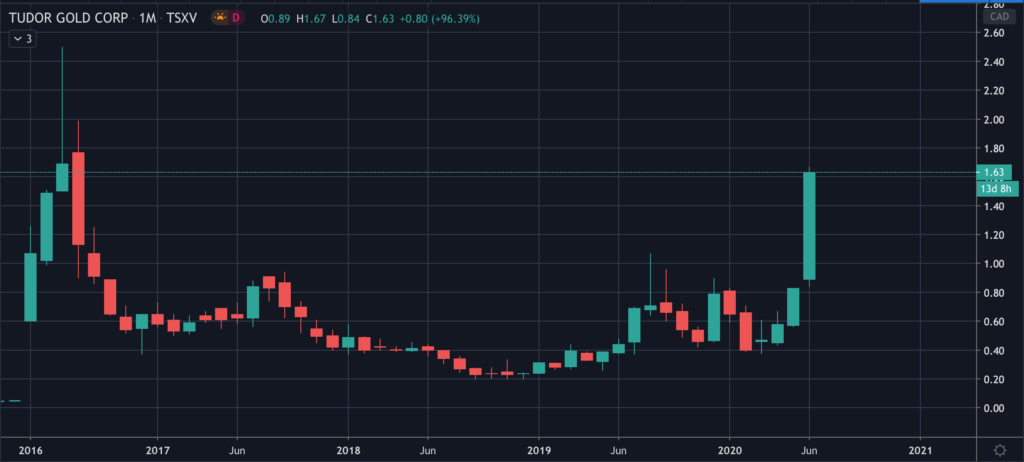
Common Stock: Tudor Gold (TSXV: TUD)
Current Market Price: $1.63 CAD
Market Capitalization: 248.1 million CAD
**Note: All values in this article are expressed in Canadian Dollars (CAD) unless otherwise noted.
Tudor Gold Stock – Summary of the Company
Tudor Gold is a mineral resource company focused on the acquisition and exploration of gold properties in Canada. They own several exploration stage projects in Canada’s “Golden Triangle” region. Tudor was founded in 2010 and is headquartered in Vancouver Canada.
Revenue and Cost Analysis
The company does not have any properties that are currently producing and therefore does not have any revenue. Tudor consistently runs a net loss and is likely to continue to do so for the foreseeable future.
For the 9-month period ending December 2019, Tudor had a net loss of $2.1 million. Their largest expenses were compensation related including share based compensation.

Balance Sheet Analysis
Tudor has a sound balance sheet with sufficient liquidity and low liability levels. Their major long term asset is an exploration and evaluation asset valued at $25 million.
Tudor Gold – Debt Analysis
As of year-end 2019 the company does not have any debt outstanding.
Tudor Gold Stock – Share Dynamics and Capital Structure
As of year-end 2019, the company had 144 million common shares outstanding. They also have significant amounts of options and warrants outstanding. Fully diluted shares outstanding is 182.5 million shares.
Tudor has a dilutive capital structure. Investors should carefully consider their place in the capital structure and the effects of dilution before investing.
Tudor Gold Stock – Dividends
The company does not pay a dividend and is unlikely to do so for the foreseeable future.
Management – Skin in the game
Insiders at Tudor Gold have been net buyers of the company’s stock in the recent past and own a significant portion of the outstanding shares, around 14%. This is generally viewed as a bullish signal for the stock.
Tudor Gold Stock – 3 Metrics to Consider
Debt to Equity Ratio
Total Liabilities/Total Share Holder Equity
$459 thousand/$31.7 million = .01
A debt to equity ratio of .01 implies Tudor is reliant entirely on equity financing to fund itself.
Price to Book Ratio
Current Share Price/Book Value per Share.
$1.63/$.17 = 9.4
Based on fully diluted shares outstanding, Tudor has a book value per share of $.17. At the current market price this implies a price to book ratio of 9.4, meaning the company trades at a significant premium to its book value.
Working Capital Ratio
Current Assets/Current Liabilities
$6.6 million/$332 thousand = 20
A working capital ratio of 20 indicates a strong liquidity position. Tudor should not have a problem meeting its near-term obligations.
Gold Market – Economic Factors and Competitive Landscape
Gold mining is a highly competitive, capital intensive business. The company will need to compete fiercely for both new projects and capital. However, given the current economic environment of global money printing and zero or negative interest rates, it would appear gold companies are poised to benefit from a strong economic tailwind.
Tudor Gold Stock – Summary and Conclusions
The company has several solid prospects in a proven gold region. They are in good financial health and actively exploring. However, their capital structure is highly dilutive and the current market valuation seems rich. I would prefer to allocate my capital to more promising exploration companies, for example Rupert. Therefore, I will not be investing in Tudor Gold stock.