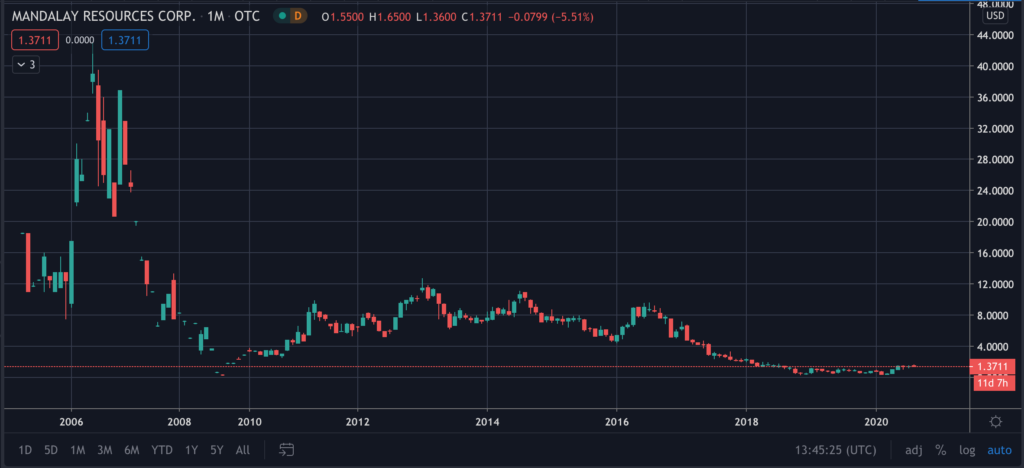
Common Stock: Mandalay Resources (TSX: MND)
Current Market Price: $1.37 USD
Market Capitalization: $126.7 million USD
**Note: All values in this article are expressed in United States Dollars (USD) unless otherwise noted.
Mandalay Resources Stock – Summary of the Company
Mandalay Resources is a gold and antimony producer focused on the acquisition, exploration, development, and operation of properties in Australia, Sweden, Chile, and Canada. The company’s producing properties are located in Australia and Sweden and they own development projects in Canada and Chile. Mandalay was founded in 1997 and is headquartered in Canada.
Revenue and Cost Analysis
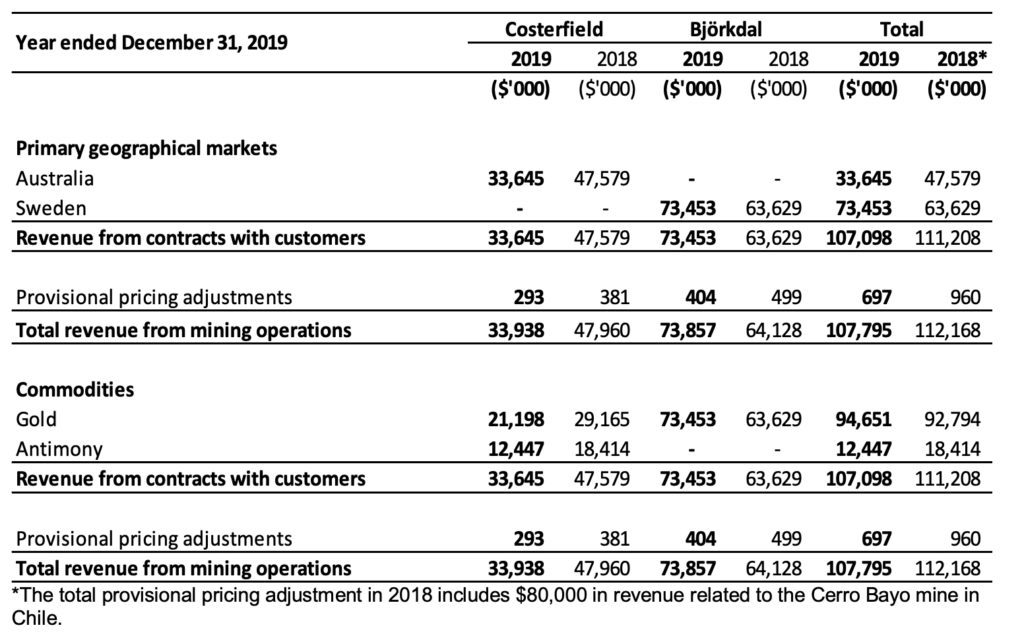
In 2019 Mandalay had total revenues of $107.8 million, a slight decrease from 2018 revenue of $112.2 million. Most of Mandalay’s revenue comes from gold sales, which totaled $94.7 million in 2019. The remainder of their revenue comes from antimony sales, which totaled $12.5 million in 2019. Gold equivalent production was 76,659 ounces in 2019 compared to 81,568 ounces in 2018.
Mandalay’s all in cost of production was around $1,500 per ounce in both 2019 and 2018. The company had a net loss of $18.6 million in 2019, an improvement from 2018’s net loss of $63.7 million.
Mandalay Resources – Royalty and Streaming Agreements
Mandalay pays a 2.75% net smelter royalty to the Australian government on all antimony sales. They also pay a .2% net smelter royalty on gold production at their Swedish property.
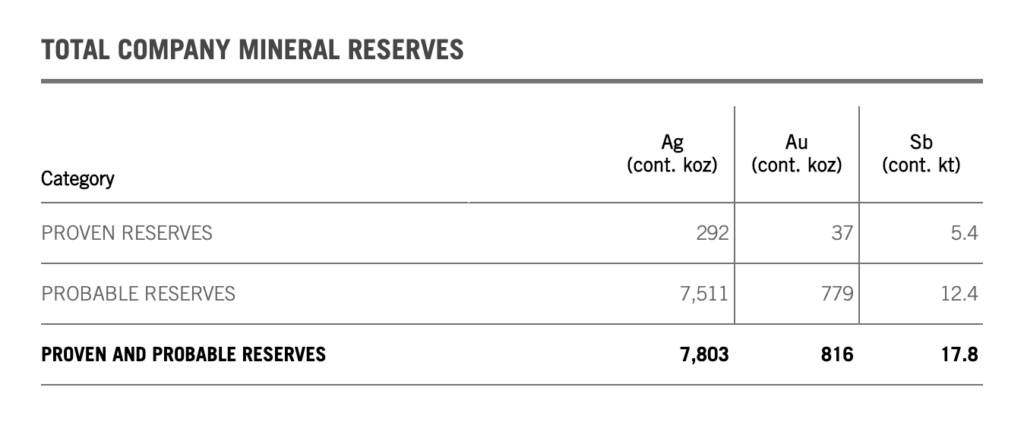
Mandalay Resources Stock – Mineral Resources
The company has proven and probable resources totaling 816,000 ounces of gold.
Balance Sheet Analysis
Mandalay does not have a strong balance sheet. They have high liability levels, including significant amounts of debt, and a constrained liquidity position.
It is worth noting that between year-end 2019 and Q2 2020 Mandalay was able to restructure its debt position and improve its liquidity levels, however their balance sheet is still not strong.
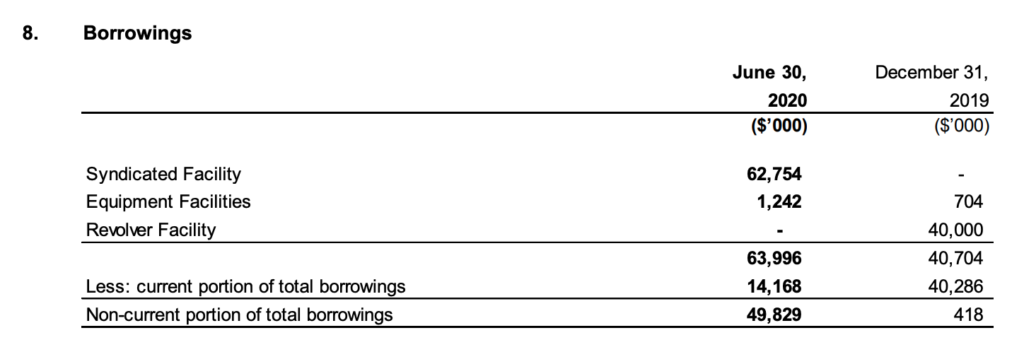
Mandalay Resources – Debt Analysis
Mandalay has a significant amount of debt. Total debt outstanding was $64 million as of June 2020.
Mandalay Resources Stock – Share Dynamics and Capital Structure
The company has 91.1 million common shares outstanding. They also have a small number of options outstanding. Fully diluted shares outstanding is 93.2 million shares.
Mandalay has very low potential dilution, so dilution should not be a major concern for investors. However, investors should carefully consider the company’s debt position and their place in the capital structure as it relates to debt holders.
Mandalay Resources Stock – Dividends
The company paid a dividend from 2012 to 2017, but has suspended dividend payments since July 2017. It is unclear if and when dividend payments will resume.
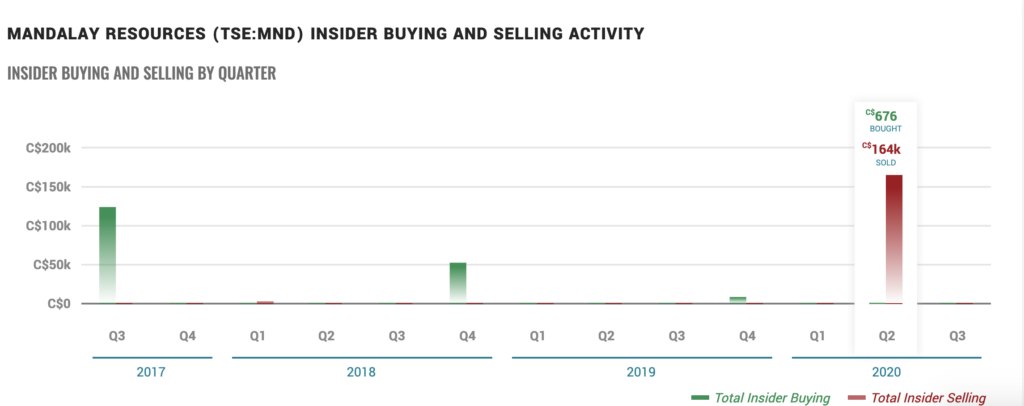
Management – Skin in the game
Insiders at Mandalay Resources have been net sellers of the company’s stock in the recent past. This is generally viewed as a bearish signal for the company’s stock.
3 Metrics to Consider
Debt to Equity Ratio
Total Liabilities/Total Share Holder Equity
$146.8/$111.8= 1.31
A debt to equity ratio of 1.31 indicates that Mandalay has more debt than equity in its capital structure and is reliant on debt financing for a significant portion of its funding.
Working Capital Ratio
Current Assets/Current Liabilities
$61.6 million/ $104 million = .59
A working capital ratio of .59 indicates that current liabilities exceeded current assets by a significant amount. Mandalay has a constrained liquidity position and may have issues meeting its obligations.
Price to Book Ratio
Current Share Price/Book Value per Share.
$1.37/$1.20 = 1.1
Based on fully diluted shares outstanding Mandalay has a book value per share of $1.20. At the current market price this implies a price to book ratio of 1.1, meaning Mandalay stock currently trades at a very slight premium to book value of the company
Gold Market – Economic Factors and Competitive Landscape
Gold mining is a highly competitive, capital intensive business. The company will need to compete fiercely for both new projects and capital. However, given the current economic environment of global money printing and zero or negative interest rates, it would appear gold companies are poised to benefit from a strong economic tailwind.
Mandalay Resources Stock – Summary and Conclusions
Mandalay is an intriguing company. They have two producing assets, both in solid jurisdictions. They also have development projects in Chile, also a solid jurisdiction. Their balance sheet has improved recently and the company is in a descent position moving forward. They also have very low potential dilution.
However, the company still presents major risks. Their Australian mine has a very limited life remaining, 3-4 years. Although they have recently restructured, their debt burden is significant. Most concerning for potential investors is the company’s zero cost collar, which has a ceiling price of $1,600 per ounce of gold, putting a significant cap on the upside to investors.
I am not going to allocate to Mandalay yet, but I will put the company at the top of my watch list and monitor their progress closely.
Disclaimer
This is not investment advice. Nothing in this analysis should be construed as a recommendation to buy, sell, or otherwise take action related to the security discussed. If I own a position in the security discussed, I will clearly state it.
This is not intended to be a comprehensive analysis and you should not make an investment decision based solely on the information in this analysis. I hope this serves as a useful starting point for a more comprehensive analysis, and hopefully draws attention to aspects of the company that were overlooked or merit further investigation. This is by no means intended to be a complete analysis. Again, this is not investment advice, do your own research.