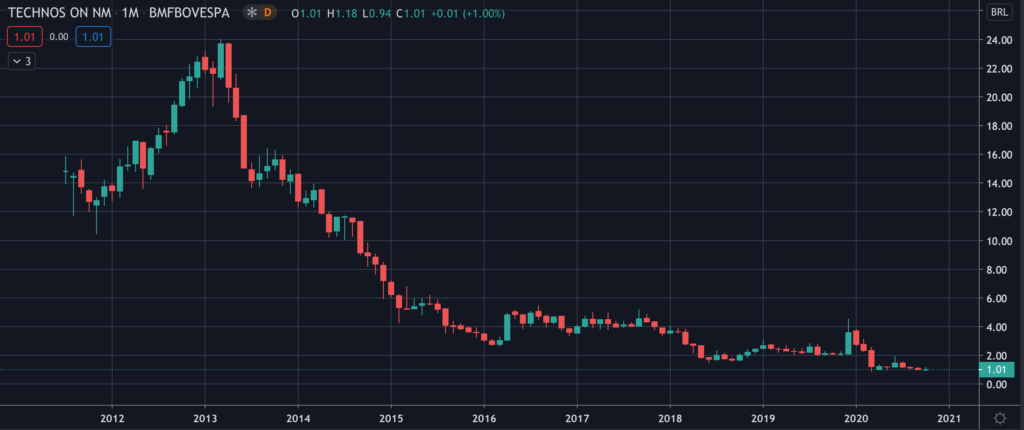
Common Stock: Grupo Technos (TECN3)
Current Market Price: R$ 1.01
Market Capitalization: R$ 79.2 million
*All values in this article are expressed in Brazilian Reais (BRL) unless otherwise noted.
**The bulk of this analysis is based on the company’s most recent audited financial report, which can be found by following this link.
Grupo Technos Stock – Summary of the Company
Grupo Technos is a Brazilian wrist watch manufacturer focused on the production and distribution of watches throughout Brazil. They have a portfolio of 18 brands, some of which are their own “Technos” brands. The earliest company in the group was founded in 1956 and Grupo Techno as it is constructed today was founded in 2007. The company is headquartered in Rio de Janeiro Brazil.
Revenue and Cost Analysis
Technos had total revenue of R$ 316 million in 2019, an increase from R$ 305.6 million in 2018. Their COGS was R$ 207 million in 2019, representing a gross margin of 35%, a significant decrease from 48% in 2018 and 46% in 2017. The company had a net loss of R$ 122 million in 2019, a significant deterioration from a profit of R$ 14 million in 2018. This deterioration is due mostly to increased operating expenses.
Balance Sheet Analysis
Technos has a decent but overly complex balance sheet. Their liquidity position is sufficient in the near term. However they have significant debt outstanding and a hedging book of currency swaps that investors need to analyze in detail before investing.
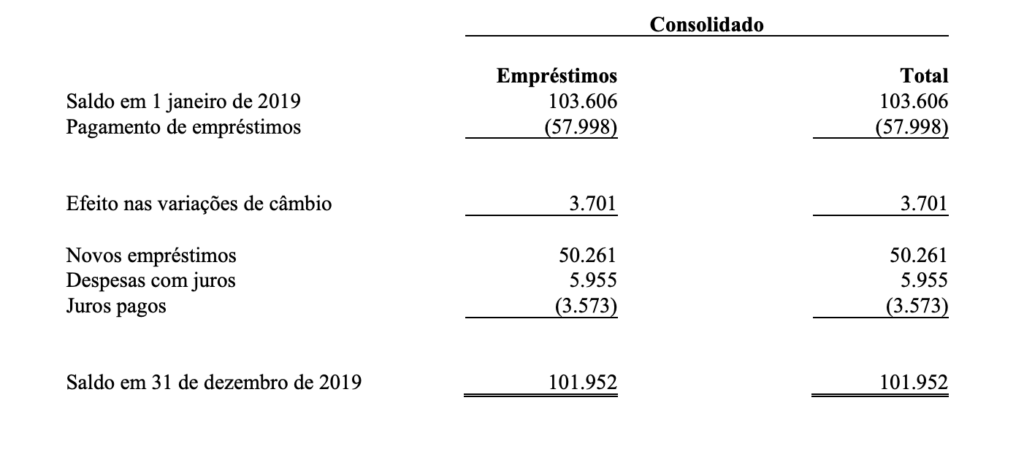
Grupo Technos – Debt Analysis
As of year-end 2019 the company has R$ 102 million in total debt outstanding, R$ 35.5 million of which is classified as current. A portion of this debt is denominated in US dollars and Euros.
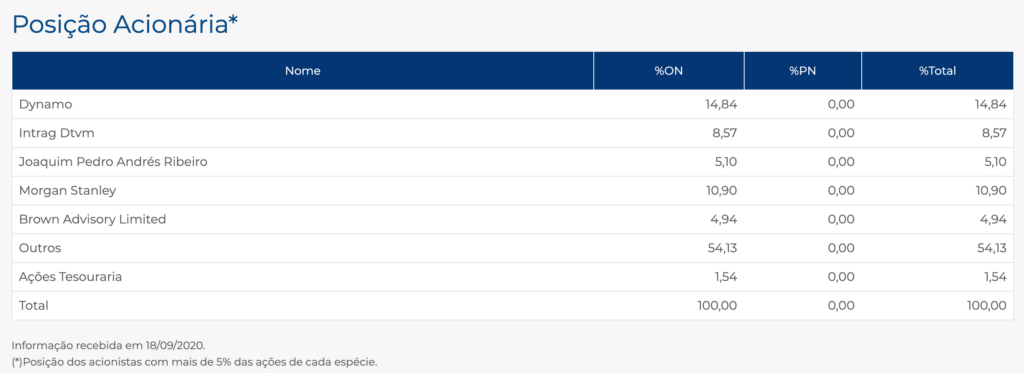
Grupo Technos Stock – Share Dynamics and Capital Structure
As of year-end 2019 the company has 78.5 million common shares outstanding. Insiders and institutional investors own around 46% of the company’s outstanding shares, with the remaining 54% being owned by smaller investors with an ownership stake of less than 5%.
Grupo Technos Stock – Dividends
The company does not currently pay a dividend.
Grupo Technos Stock – 3 Metrics to Consider
Debt to Equity Ratio
Total Liabilities/Total Share Holder Equity
R$ 331.6 million / R$ 344.4 million = .96
A debt to equity ratio of .96 indicates that Technos uses nearly equal amounts of debt and equity in its capital structure and is not overly reliant on either form of financing.
Working Capital Ratio
Current Assets/Current Liabilities
R$ 392.7 million / R$ 163 million = 2.4
A working capital ratio of 2.4 indicates a sound liquidity position. Technos should not have a problem meeting its near term obligations.
Price to Book Ratio
Current Share Price/Book Value per Share.
R$ 1.01 / R$ 4.39 = .23
Technos has a book value per share of R$ 4.39. At the current market price this implies a price to book ratio of .23, meaning the company’s stock currently trades at a significant discount to the book value of the company.
Grupo Technos Stock – Summary and Conclusions
I don’t see any reason to invest in Grupo Technos stock, especially when compared to other Brazilian manufacturers. I am not interested in investing in a Brazilian watch manufacturer with exposure to the US dollar and Euro carry trade. Furthermore I don’t see a good justification for a watch manufacturer having exposure to complex currency derivatives. If I had to invest in Brazilian equities, I would prefer to allocate to a company like Dohler, that has more straight forward and conservative finances.
Disclaimer
This is not investment advice. Nothing in this analysis should be construed as a recommendation to buy, sell, or otherwise take action related to the security discussed. If I own a position in the security discussed, I will clearly state it.
This is not intended to be a comprehensive analysis and you should not make an investment decision based solely on the information in this analysis. I hope this serves as a useful starting point for a more comprehensive analysis, and hopefully draws attention to aspects of the company that were overlooked or merit further investigation. This is by no means intended to be a complete analysis. Again, this is not investment advice, do your own research.