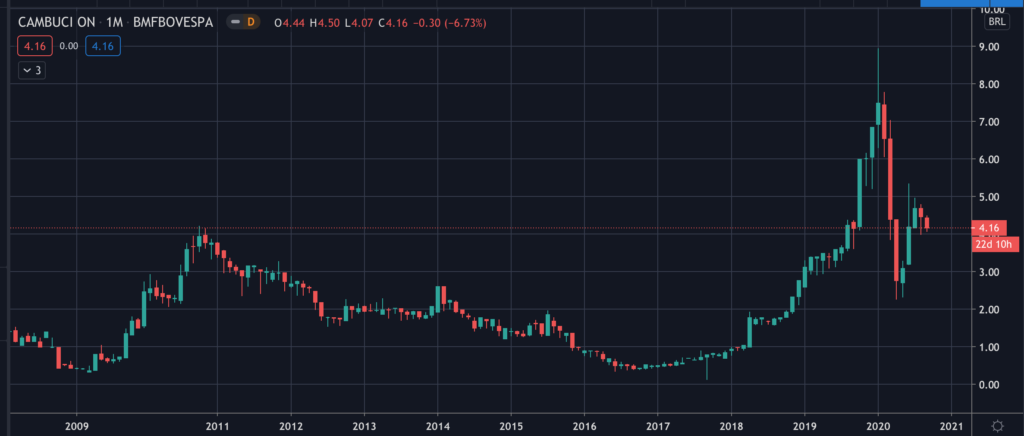
Common Stock: Cambuci (CAMB3)
Current Market Price: R$ 4.16
Market Capitalization: R$ 174.6 million
*All values in this article are expressed in Brazilian Reis (BRL) unless otherwise noted.
**The bulk of this analysis is based on the company’s most recent audited financial report, which can be found by following this link.
Cambuci Stock – Summary of the Company
Cambuci is a sports apparel company that manufactures, imports, exports, and represents third party sporting goods products. The also stamp and embroider their own products or provide this service to third parties.
The company is best known for its brands “Penalty” and “Stadium” which can be found at over 1,500 points of sale. Some of their most popular products are cleats, footballs, socks, and gloves.

They have two industrial plants in the state of Bahia and one in the state of Parana. Cambuci was founded in 1945 and is headquartered in Sao Paulo Brazil.
Revenue and Cost Analysis
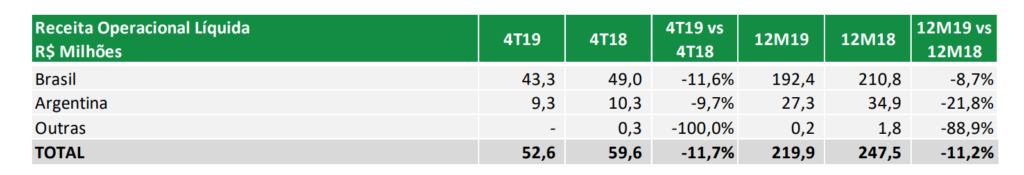
Cambuci has total sales of R$ 219.8 million in 2019. Sales have been declining for several years, in 2017 the company had sales of R$ 259.4 million and in 2018 R$247.4 million. In 2019, the company’s COGS was R$123 million, representing a gross margin of 44%.
The majority of the company’s revenue comes from Brazil, but they do have relevant sales in Argentina, and a very small amount of revenue in Uruguay. Previously the company operated in Spain, Paraguay, and Chile, but these operations are currently halted.
Despite declining sales, the company has been profitable in each of the past 3 years. In 2019 Cambuci had net income of R$ 20.2 million representing a profit margin of 9%.
Balance Sheet Analysis
Cambuci has a descent but by no means strong balance sheet. The have sufficient liquidity in the short term, but debt levels have been, and are likely to continue to be, a drag on the company’s results.
Cambuci – Debt Analysis
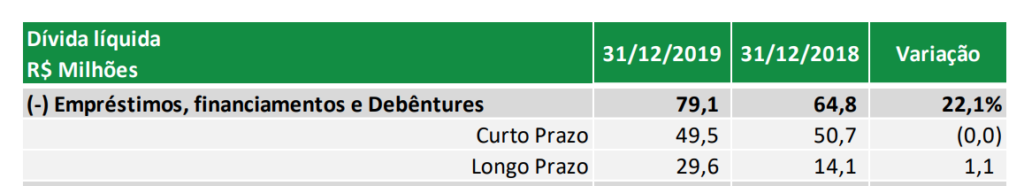
The company has a significant debt burden. At year end 2019, total debt outstanding was R$ 79.1 million, R$ 49.5 million of which is due in the short term. This represents a significant increase in debt from 2018.
Cambuci Stock – Share Dynamics and Capital Structure
As of year-end 2019 the company had 42 million common shares outstanding.
Dividends
The company does not currently pay a dividend.
3 Metrics to Consider
Debt to Equity Ratio
Total Liabilities/Total Share Holder Equity
R$169.2 million/R$74 million = 2.3
A debt to equity ratio of 2.3 indicates that Cambuci relies heavily on debt financing to fund itself.
Working Capital Ratio
Current Assets/Current Liabilities
R$ 110.3 million/ R$ 98 million = 1.1
A working capital ratio of 1.1 indicates sufficient but not strong liquidity. Although Cambuci should not have problems meeting its near-term obligations, investors should monitor the company’s liquidity position closely.
Price to Book Ratio
Current Share Price/Book Value per Share.
R$ 4.16/R$ 1.76 = 2.3
Cambuci has a book value per share of R$1.76. At the current market price this implies a price to book ratio of 2.3, meaning the company’s stock trades at a premium to the book value of the company.

Cambuci Stock – Summary and Conclusions
Cambuci owns two well-known brands with well established distribution networks. Despite declining sales, the company has been able to improve its operating margins over the past several years, evidenced by improving operating margins. The company is profitable.
However, the apparel business is highly competitive and is not an industry I am generally interested in investing in. Furthermore, Cambuci has a heavy debt burden, which significantly increases risk to common shareholders. Cambuci is a descent company with a long history, but it is not the type of company/situation I am comfortable investing in.
Disclaimer
This is not investment advice. Nothing in this analysis should be construed as a recommendation to buy, sell, or otherwise take action related to the security discussed. If I own a position in the security discussed, I will clearly state it.
This is not intended to be a comprehensive analysis and you should not make an investment decision based solely on the information in this analysis. I hope this serves as a useful starting point for a more comprehensive analysis, and hopefully draws attention to aspects of the company that were overlooked or merit further investigation. This is by no means intended to be a complete analysis. Again, this is not investment advice, do your own research.