Common Stock: Alliar (AALR3)
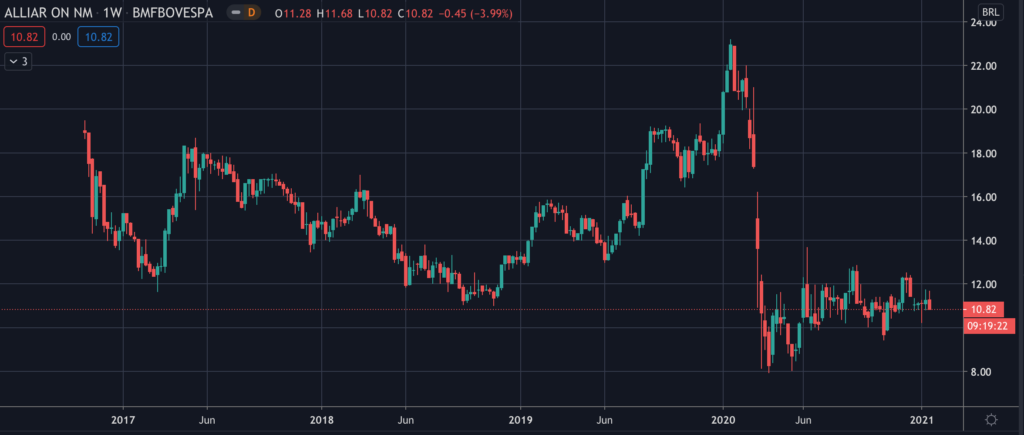
Current Market Price: R$ 10.82
Market Capitalization: R$ 1.3 Billion
*All values in this article are expressed in Brazilian Reais (BRL) unless otherwise noted.
**The bulk of this analysis is based on the company’s most recent audited financial report, which can be found by following this link.

Alliar Stock – Summary of the Company
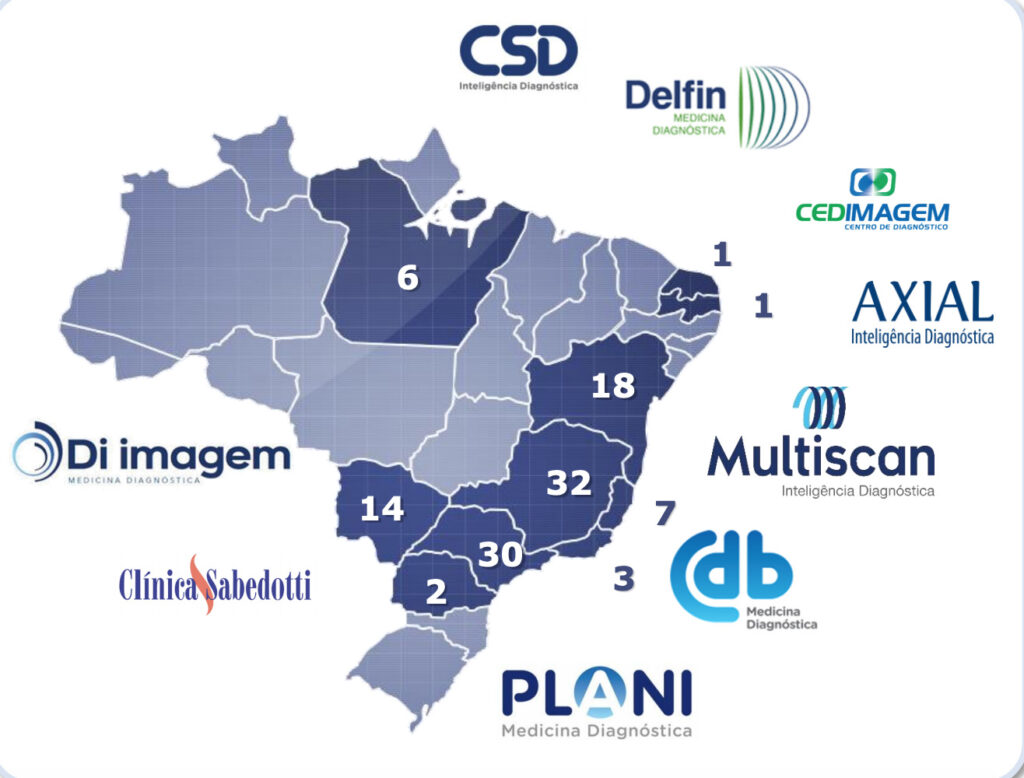
Alliar is the second largest diagnostic imaging company in Brazil. Some of their main diagnostic machines include MRI machines, CT scanners, and ultrasound machines, among others. They have 124 services centers located in 10 states. The company has around 900 physician service providers and over 5000 employees. Alliar was founded in 2011 when 4 of the leading diagnostics company’s in Brazil merged. Since then the company has made 20 acquisitions. Alliar is headquartered in Sao Paulo, Brazil.

Revenue and Cost Analysis
Alliar had revenue of R$ 1.1 billion in 2019, almost exactly equal to its revenue in both 2018 and 2017. They company’s COGS in 2019 was R$ 788 million, representing a gross margin of 27%, also equal to their gross margin in the previous year.
Th company was profitable in each of the last three years. In 2019 Alliar had net income of R$ 50 million, representing a profit margin of 4.7%, also equal to their profit margin in 2018.
Balance Sheet Analysis
Alliar has a decent balance sheet. Their liquidity position is sufficient, but not strong, and they have a solid base of long term assets. However they do have a relevant amount of debt outstanding, although they do not appear over leveraged.
Alliar – Debt Analysis
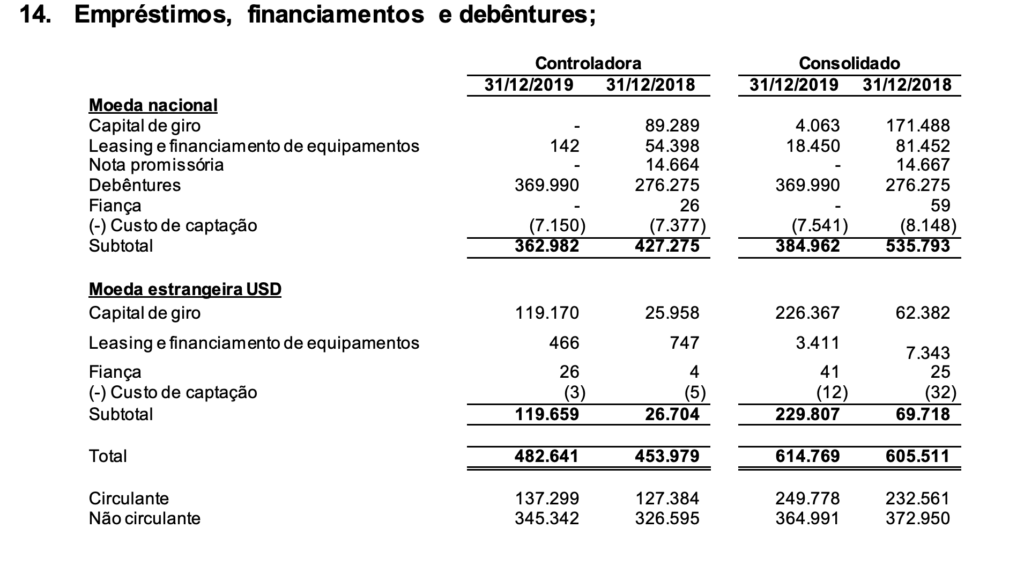
As of year-end 2019 Alliar has total debt outstanding of R$ 614.8 million , R$ 249.8 million of which is classified as current. Alliar has a relevant amount of debt denominated in foreign currency. R$ 229.8 million of their debt is denominated in US dollars, exposing the company to the negative effects of a depreciating Brazilian Real.

Alliar Stock – Share Dynamics and Capital Structure
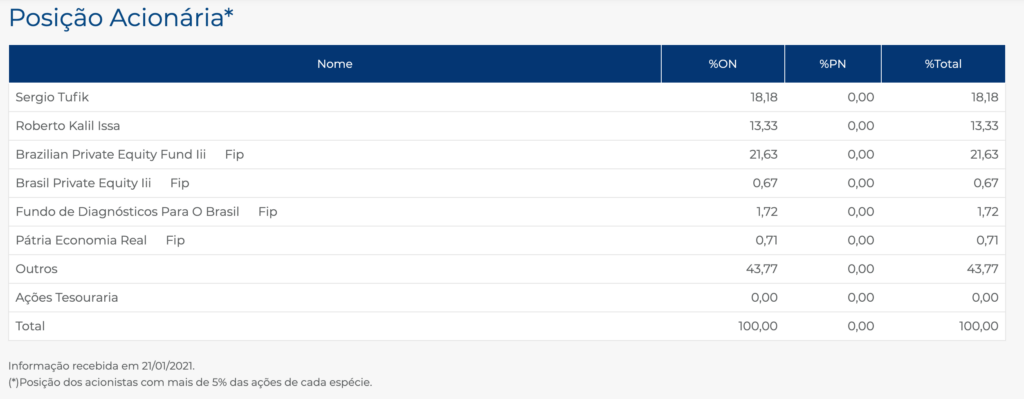
As of year-end 2019 Alliar has 118.3 million common shares outstanding. Insiders and institutional investors own around 56% of the company’s outstanding shares. The remaining 44% are owned by smaller shareholders with an ownership position of less than 5%.

Alliar Stock – Dividends
Based on 2019’s results Alliar paid total dividends of R$ 0.087 cents per common shares. At the current market price this implies a dividend yield of 0.8%.
Alliar Stock – 3 Metrics to Consider
Debt to Equity Ratio
Total Liabilities/Total Share Holder Equity
R$ 1.1 billion / R$ 1.3 billion = .82
A debt to equity ratio of .82 indicates that Alliar uses a mix of debt and equity in its capital structure, but relies slightly more on equity financing to fund itself.
Working Capital Ratio
Current Assets/Current Liabilities
R$ 417 million / R$ 406 million = 1.02
A working capital ratio of 1.02 indicates a sufficient, but not strong liquidity position. Alliar should not have problems meeting its near term obligations, but investors should monitor the company’s liquidity position closely.
Price to Book Ratio
Current Share Price/Book Value per Share.
R$ 10.82 / R$ 11.15 = .97
Alliar has a book value per share of R$ 11.15. At the current market price this implies a price to book ratio of .97, meaning Alliar stock currently trades at a slight discount to the book value of the company.
Alliar Stock – Summary and Conclusions
2020 was surely a crazy year for Alliar. The coronavirus pandemic likely had a huge impact on their business. I would suspect long term what happened in 2020 will be positive for diagnostic companies like Alliar, but that’s just a hunch.
The company appears to be well run and in decent financial health, however their US Dollar denominated debt is concerning. Given their aggressive acquisition strategy, I would need to do a much more detailed analysis of Alliar’s financials before drawing any conclusions.
I am not willing to make any investment decisions until I see the company’s full year 2020 financials. I will be very curious to see how the pandemic impacted their business and compare Alliar stock to similar Brazilian stocks, such as Grupo Dimed.
Disclaimer
This is not investment advice. Nothing in this analysis should be construed as a recommendation to buy, sell, or otherwise take action related to the security discussed. If I own a position in the security discussed, I will clearly state it.
This is not intended to be a comprehensive analysis and you should not make an investment decision based solely on the information in this analysis. I hope this serves as a useful starting point for a more comprehensive analysis, and hopefully draws attention to aspects of the company that were overlooked or merit further investigation. This is by no means intended to be a complete analysis. Again, this is not investment advice, do your own research.