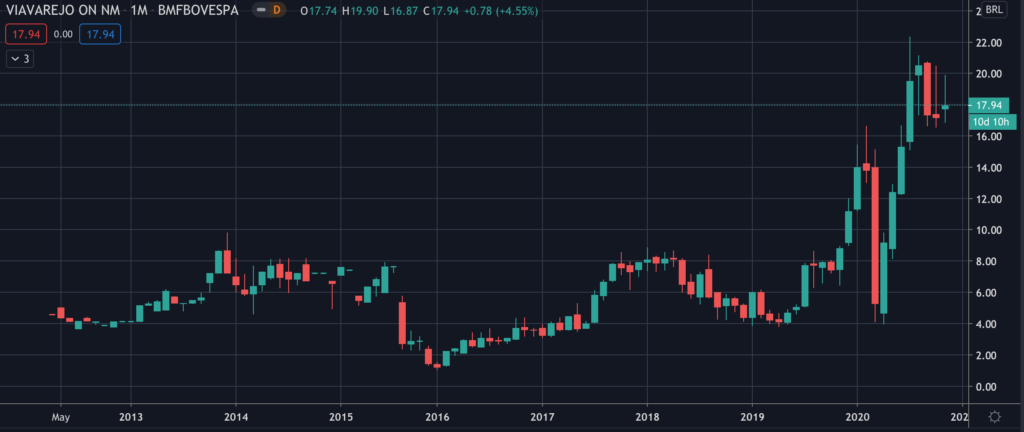
Common Stock: Via Varejo (VVAR3)
Current Market Price: R$ 17.94
Market Capitalization: R$ 28.6 billion
*All values in this article are expressed in Brazilian Reais (BRL) unless otherwise noted.
**The bulk of this analysis is based on the company’s most recent audited financial report, which can be found by following this link.
***Please note that as of October 2019 the company is investigating accounting irregularities due to an “anonymous report”. Please take this into account and understand that some, if not all of these number may be inaccurate. Do your own research.
Vis Varejo Stock – Summary of the Company
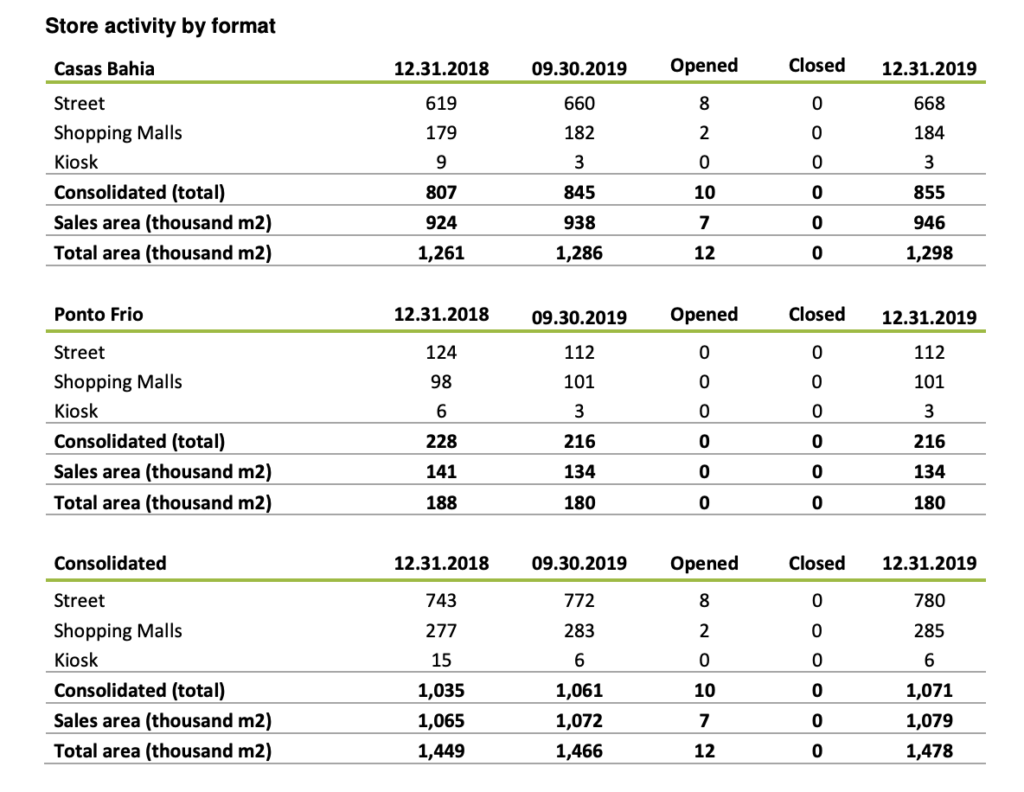
Via Varejo is a Brazilian retailer and the largest furniture retailer in Brazil. Their two brands are Casas Bahia and Ponto Frio, which combined have over 1000 stores throughout Brazil. The company is investing heavily in its ecommerce business and as of January 2020 has 7.6 million active users on its apps. Via Varejo was founded in 2010 and is headquartered in Sao Paulo Brazil. They employ around 45,000 people.
Revenue and Cost Analysis
Via Varejo had revenue of R$ 25.6 billion in 2019, a decrease from R$ 26.9 billion in 2018. Their COGS was R$ 18.3 billion in 2019, representing a gross margin of 28.6%, also a decrease compared to 29.8% in 2018. The company was not profitable in either of the past two years. They had a net loss of R$ 1.4 billion in 2019, a deterioration compared to a loss of R$ 291 million in 2018.
Via Varejo claims to have the largest Black Friday in Brazil. In 2019 they had Black Friday sales of R$ 1.1 billion, 48% of which was online.
Balance Sheet Analysis
Via Varejo has a highly leveraged balance sheet. Their liquidity position is weak and they have excessive levels of liabilities.
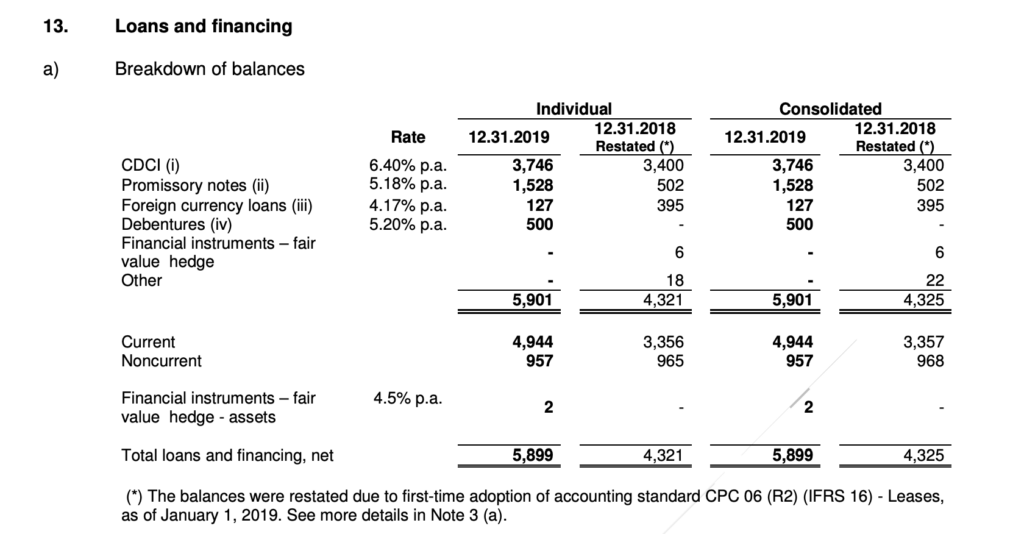
Via Varejo – Debt Analysis
As of year-end 2019 Via Varejo has R$ 5.9 billion in total debt outstanding, R$ 4.9 billion of which is classified as current.
Via Varejo Stock – Share Dynamics and Capital Structure
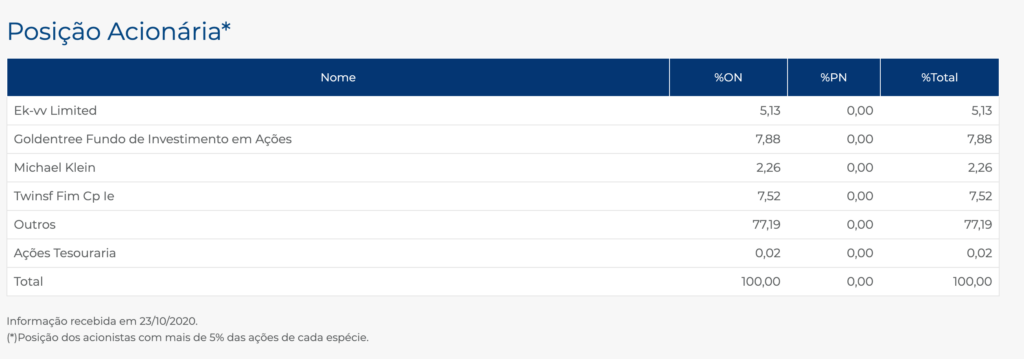
As of October 2020 Via Varejo has 1.6 billion common shares outstanding. Insiders and institutional investors own around 23% of the company, with the remaining 77% being held by smaller shareholders with less than a 5% ownership position.
Via Varejo Stock – Dividends
The company did not pay a dividend in either 2018 or 2019.
Via Varejo Stock – 3 Metrics to Consider
Debt to Equity Ratio
Total Liabilities/Total Share Holder Equity
R$ 578 million / R$ 23.8 billion = 41
A debt to equity ratio of 41 indicates that Via Varejo is highly leveraged and depends heavily on debt financing to fund itself.
Working Capital Ratio
Current Assets/Current Liabilities
R$ 12.4 billion / R$ 15.7 billion = .79
A working capital ratio of .79 indicates a weak liquidity position. Investors should carefully monitor the company’s liquidity as they may face issues meeting their near term obligations.
Price to Book Ratio
Current Share Price/Book Value per Share.
R$ 17.94 / R$ 0.36 = 50
Via Varejo has a book value per share of R$ 0.36. At the current market price this implies a price to book ratio of 50, meaning Via Varejo stock currently trades at a huge premium to the book value of the company.
Via Varejo Stock – Summary and Conclusions
Via Varejo is a beast of a company. They have a huge presence, brand recognition, and are growing their e-commerce business. However I don’t invest in businesses that are investigating “accounting irregularities due to anonymous reports”. At best management is asleep at the wheel, at worst they are intentionally misrepresenting their financials. Either way I am not interested in investing in Via Varejo stock. I would much prefer to allocate to other Brazilian retailers such as Grendene.
Disclaimer
This is not investment advice. Nothing in this analysis should be construed as a recommendation to buy, sell, or otherwise take action related to the security discussed. If I own a position in the security discussed, I will clearly state it.
This is not intended to be a comprehensive analysis and you should not make an investment decision based solely on the information in this analysis. I hope this serves as a useful starting point for a more comprehensive analysis, and hopefully draws attention to aspects of the company that were overlooked or merit further investigation. This is by no means intended to be a complete analysis. Again, this is not investment advice, do your own research.