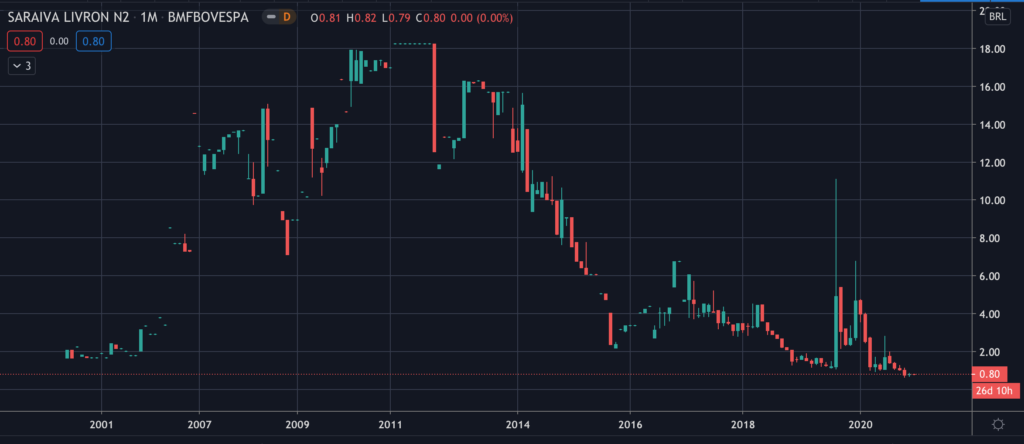
Common Stock: Saraiva Livreiros (SLED3)
Current Market Price: R$ 0.80
Market Capitalization: R$ 51.1 million
*All values in this article are expressed in Brazilian Reais (BRL) unless otherwise noted.
**The bulk of this analysis is based on the company’s most recent audited financial report, which can be found by following this link.
*** The company entered into bankruptcy and restructuring proceeding in 2019, which are currently ongoing.
Saraiva Stock – Summary of the Company
Saraiva Livreiros is one of the leading bookstore chains in Brazil. Their products include books, games, films, and stationary, which they sell through their e-commerce platform and 73 retail locations. As of year-end 2019 they employed around 1,800 people, but plan to downsize further. Saraiva Livreiros was founded in 1914 and is headquartered in Sao Paulo, Brazil.
Revenue and Cost Analysis
Saraiva had revenue of R$ 669.7 million in 2019, a huge decrease compared to R$ 1.4 billion in 2018. Their COGS was R$ 470.2 million in 2019, representing a gross margin of 30%, on par with their gross margin of 28% in 2018.
The company had significant losses in each of the last two years. In 2019 Saraiva had a net loss of R$ 318 million, slightly higher than their net loss of R$ 301 million in 2018.
Balance Sheet Analysis
Saraiva has a weak balance sheet. Given that the company is undergoing bankruptcy proceedings, I think this is stating the obvious. They have a poor liquidity position and high liability levels, including debt.
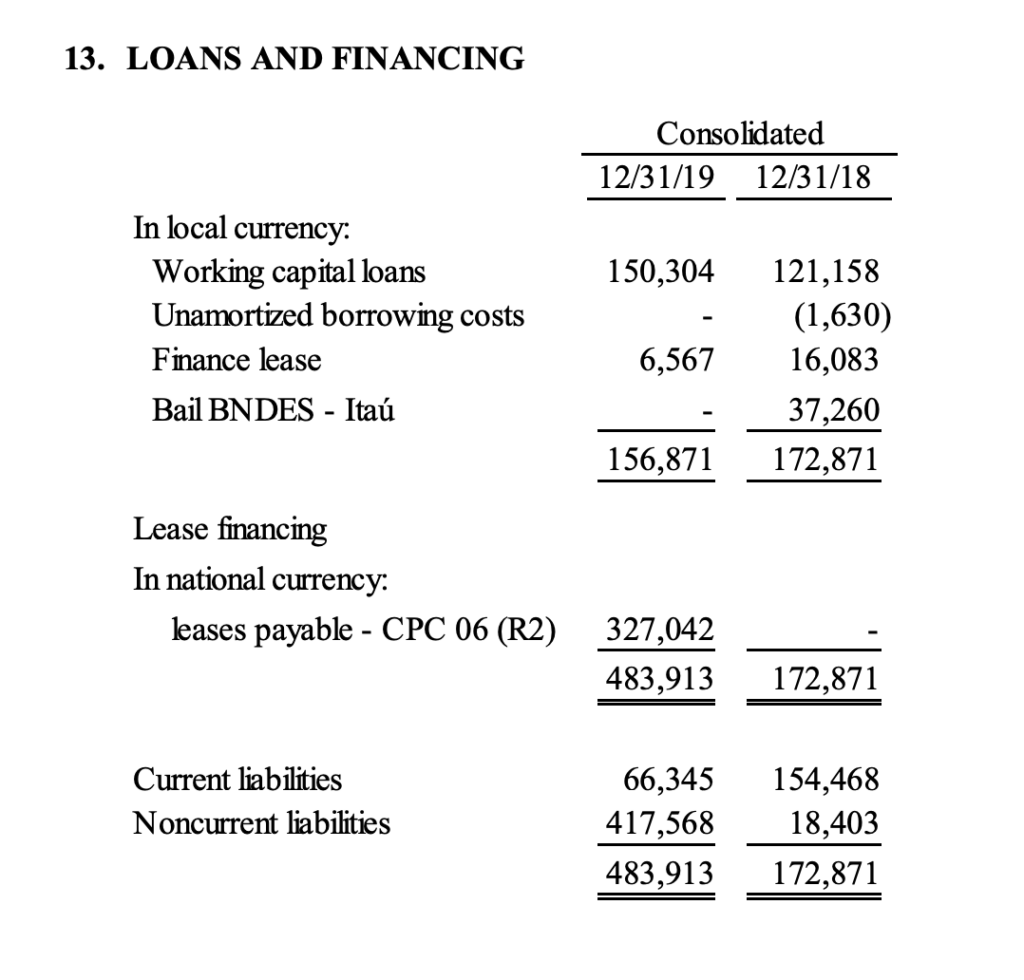
Saraiva – Debt Analysis
As of year-end 2019 Saraiva has R$ 483.9 million in total debt outstanding, R$ 66.3 million of which is classified as current.
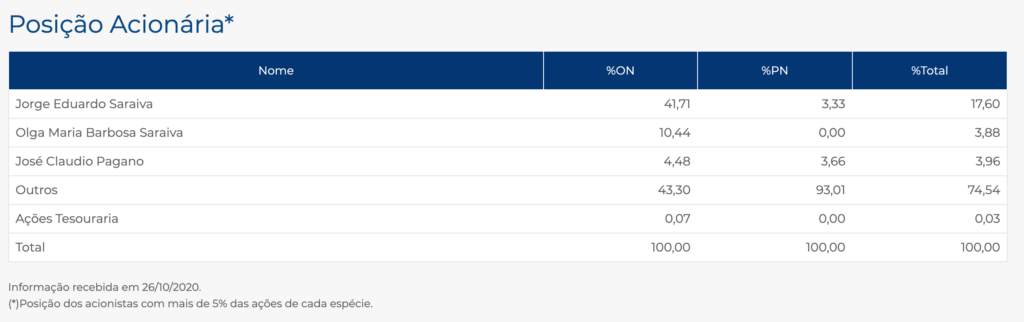
Saraiva Stock – Share Dynamics and Capital Structure
As of October 2020, Saraiva has 23.5 million common shares outstanding and 39.6 million preferred shares outstanding. Total shares outstanding is around 63.1 million shares. Insiders and the company’s treasury own around 25% of the company, with the remaining 75% being held by smaller shareholders with an ownership position of less than 5%.
Saraiva Stock – Dividends
The company did not pay a dividend based on 2019 or 2018’s results.
Saraiva Stock – 2 Metrics to Consider
Debt to Equity Ratio
Total Liabilities/Total Share Holder Equity
R$ 1 billion / -R$ 172.7 million = -5.9
A debt to equity ratio of negative 5.9 indicates that Saraiva has accumulated losses and has significantly more liabilities than shareholder equity. The company faces the possibility of insolvency and investors should carefully analyze the company’s liabilities before investing.
Working Capital Ratio
Current Assets/Current Liabilities
R$ 233.7 million / R$ 263.7 million = .88
A working capital ratio of .88 indicates a poor liquidity position. Saraiva may have problems meeting its near term obligations.
Saraiva Stock – Summary and Conclusions
Saraiva was in very poor financial health entering 2020. Given their heavy brick and mortar presence, I expect that the company deteriorated even further due to the corona virus shut downs. The company is restructuring, but given the growing presence e-commerce in Brazil, I wouldn’t invest in Saraiva stock under any circumstances. I have seen this story play out before in The United States (think Barnes and Nobles vs Amazon). I only analyzed the company since I am a bibliophile and have shopped in Saraiva store many times, but investors would be better served by considering other Brazilian retailers, such as Alpargatas or Lojas Renner.
Disclaimer
This is not investment advice. Nothing in this analysis should be construed as a recommendation to buy, sell, or otherwise take action related to the security discussed. If I own a position in the security discussed, I will clearly state it.
This is not intended to be a comprehensive analysis and you should not make an investment decision based solely on the information in this analysis. I hope this serves as a useful starting point for a more comprehensive analysis, and hopefully draws attention to aspects of the company that were overlooked or merit further investigation. This is by no means intended to be a complete analysis. Again, this is not investment advice, do your own research.