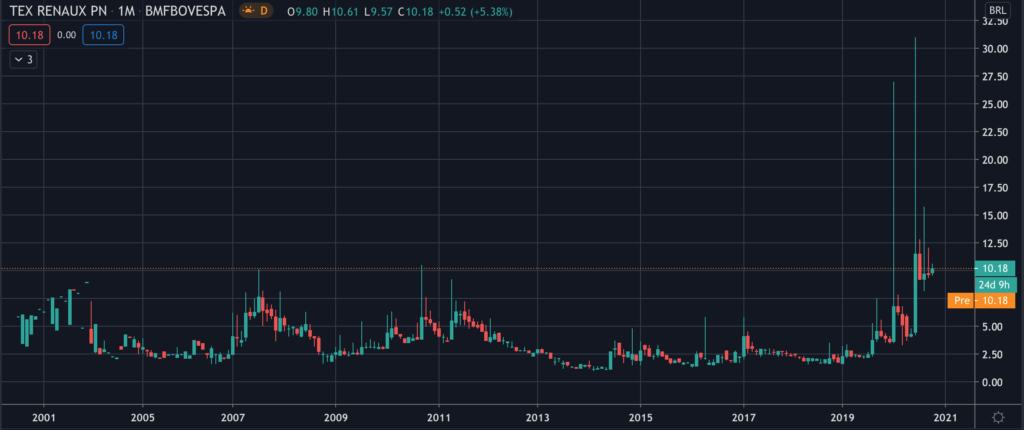
Preferred Stock: RenauxView (TXRX4)
Current Market Price: R$ 10.18
Market Capitalization: R$ 116 million
*All values in this article are expressed in Brazilian Reais (BRL) unless otherwise noted.
**The bulk of this analysis is based on the company’s most recent audited financial report, which can be found by following this link.
RenauxView Stock – Summary of the Company
RenauxView is a Brazilian textile manufacturer. Their main products are cotton threads and fabrics. The company was founded in 1892 and is headquartered in the state of Santa Caterina, Brazil.
Revenue and Cost Analysis
RenauxView has grown its revenue significantly over the past several years. In 2017 total revenue was R$ 85 million, which increased to R$ 87.3 million in 2018 and increased further to R$ 105 million in 2019. The company has been able to increase its gross margins at the same time. Gross margin increased from 29% in 2017 to 31% in 2019.
RenauxView has significant debt service expenses, which have been a drag on earnings. This caused the company to have a net loss of R$ 11.4 million in 2018. However these expenses decreased in 2019, and RenauxView had a profit of R$ 21.4 million in 2019, representing a profit margin of around 20%.
Balance Sheet Analysis
RenauxView has a weak balance sheet. The company has very poor liquidity and high liability levels, including debt.
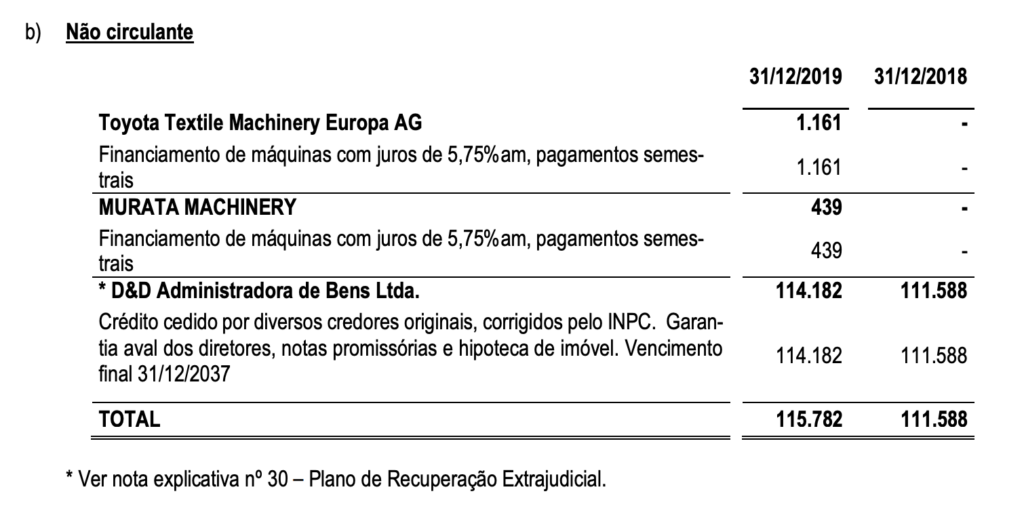
RenauxView – Debt Analysis
As of year-end 2019, the company has R$ 206 million in debt outstanding, of which R$ 90.1 million is classified as current.
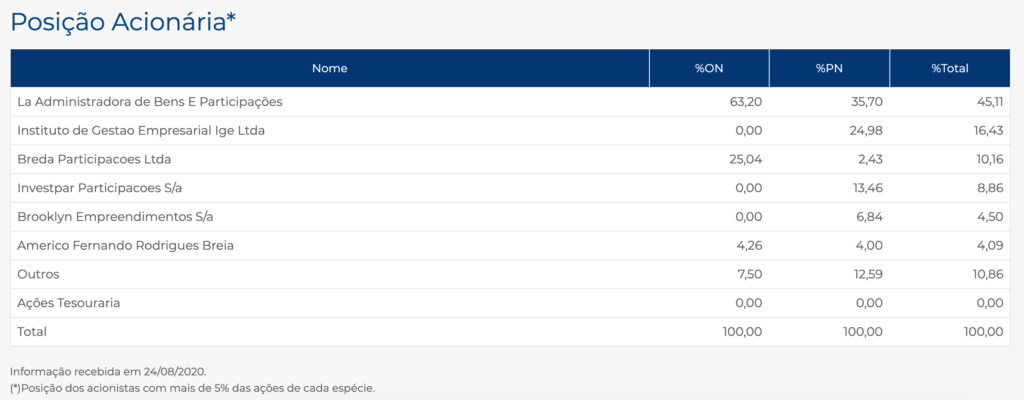
RenauxView Stock – Share Dynamics and Capital Structure
As of year-end 2019, the company has 1.5 million common shares outstanding and 2.8 million preferred shares outstanding. Total shares outstanding is around 4.3 million shares. Most of the company is owned by several institutions and funds.
RenauxView Stock – Dividends
The company does not currently pay a dividend.
RenauxView Stock – 2 Metrics to Consider
Debt to Equity Ratio
Total Liabilities/Total Share Holder Equity
R$ 475.7 million / -R$ 291.3 million = -1.6
A debt to equity ratio of negative 1.6 indicates that RenauxView has accumulated losses and has significantly more liabilities than shareholder equity. The company faces the possibility of insolvency and investors should carefully analyze the company’s liabilities before investing.
Working Capital Ratio
Current Assets/Current Liabilities
R$ 58.9 million / R$ 319.7 million = .18
A working capital ratio of .18 indicates a very weak liquidity position. RenauxView may have problems meeting its short term obligations.
RenauxView Stock – Summary and Conclusions
RenauxView is a Brazilian textile manufacturer with a long history of operations. I have said this before, but any company that has been operating since the 1800’s is impressive. The company has been growing total sales for several years, while maintaining its gross margins. The company was profitable in 2019, however they did not return capital to shareholders via a dividend.
The problem with RenauxView stock for investors is that the company is over leveraged. The company has excessive amounts of debt and its liquidity position is very weak. Their financial position is similar to Karsten, another Brazilian textiles manufacturer. Due to RenauxView’s poor financial health, I am not willing to invest in the their stock. If I were going to allocate to a Brazilian textiles company, I would prefer to invest in Dohler, which has a cleaner balance sheet.
Disclaimer
This is not investment advice. Nothing in this analysis should be construed as a recommendation to buy, sell, or otherwise take action related to the security discussed. If I own a position in the security discussed, I will clearly state it.
This is not intended to be a comprehensive analysis and you should not make an investment decision based solely on the information in this analysis. I hope this serves as a useful starting point for a more comprehensive analysis, and hopefully draws attention to aspects of the company that were overlooked or merit further investigation. This is by no means intended to be a complete analysis. Again, this is not investment advice, do your own research.