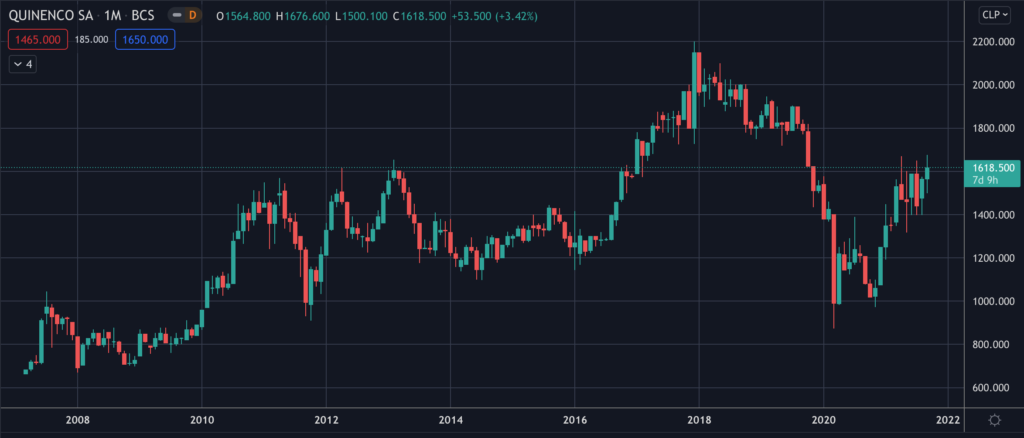
Common Stock: Quiñenco
Current Market Price: $1618.5 (CLP); $2.06 (USD)
Market Capitalization: $2.7 trillion (CLP); $3.4 billion (USD)
*All values in this article are expressed in Chilean Pesos (CLP) unless otherwise noted.
**The bulk of this analysis is based on the company’s most recent audited financial report, which can be found by following this link.
Quiñenco Stock – Summary of the Company
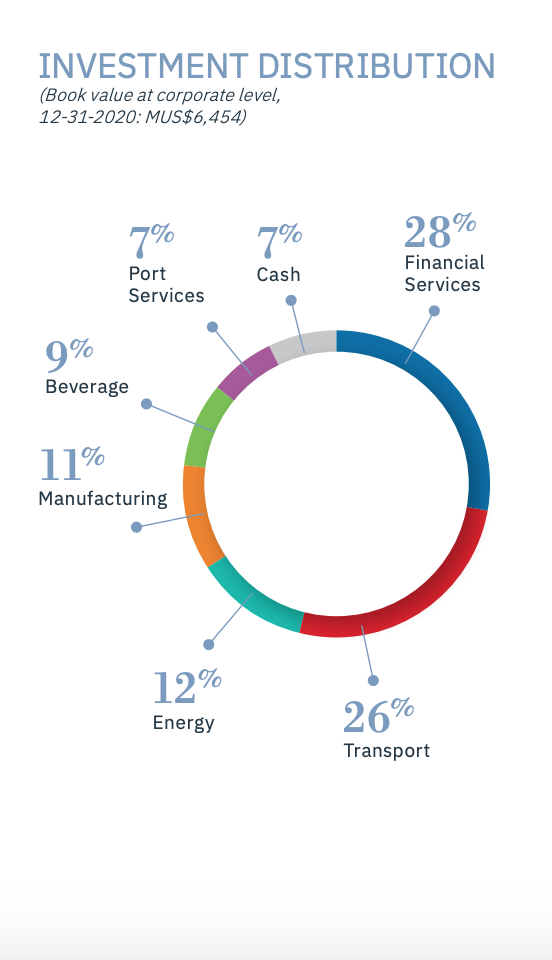
Quiñenco is a Chilean investment conglomerate and one of the largest businesses in the country. Their investments are primarily in the financial and industrial sectors, but they also have investments in ports, beverages, and energy. The company has a presence in 129 countries and employs over 68,000 people. Quiñenco has $97.7 billion USD in assets and has major investments in major international companies such as Nexans and Hapag-Lloyd.
Quiñenco was founded in 1957 and is headquartered in Las Condes, Chile.
Revenue and Cost Analysis
In 2020 Quiñenco had total non-banking revenue of $2.6 trillion, a decrease from $2.9 trillion in 2019. Non-banking net income was $216.1 billion, a significant increase from $120 billion in 2019.
Including the company’s banking operations, total net income in 2020 was $679.4 billion, a slight decrease from $685.5 billion the previous year.
Balance Sheet Analysis
Overall Quiñenco has a decent balance sheet. Their near term liquidity is strong and they have a diversified base of long term assets which are investments in subsidiaries.
The company’s balance sheet is complex due to their significant banking investments. Investors should analyze the company’s banking operations in detail before investing.
Debt Analysis
As of year-end 2020 the company has $2.1 trillion in total debt outstanding, $286 billion of which is classified as current.
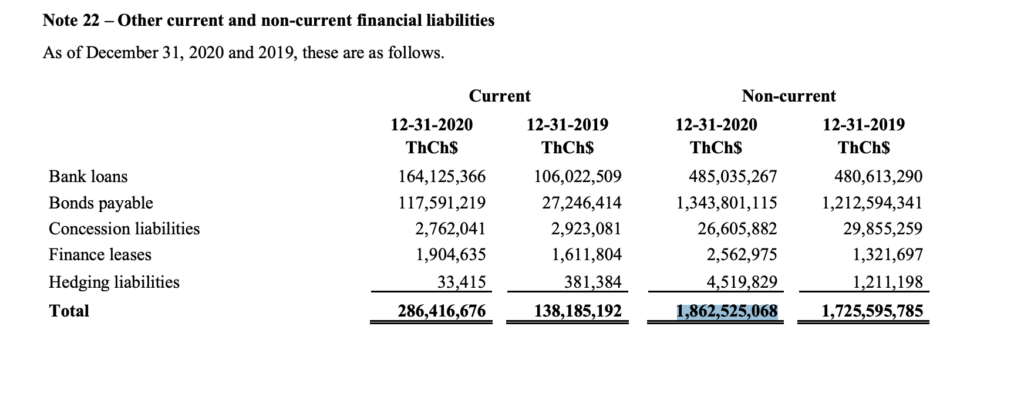
Fitch rates the company’s debt as AA, investment grade.
Quiñenco Stock – Share Dynamics and Capital Structure
As of year-end 2020 the company has 1.66 billion common shares outstanding. The company’s majority shareholder, The Luksic Group, owns 83% of the company, with the remainder being held by over 1,000 minority shareholders.
Quiñenco Stock – Dividends
In 2020 the company paid total dividends of $37.89 per share. At the current market price this implies a dividend yield of 2.3%
Quiñenco Stock – 3 Metrics to Consider
Debt to Equity Ratio
Total Liabilities/Total Share Holder Equity
$45.1 trillion / $7.8 trillion = 5.8
A debt to equity ratio of 5.8 indicates that Quiñenco is leveraged and relies heavily on debt financing for funding. It is worth noting that the nature of the company’s significant banking investments affect the company’s leverage ratios.
Working Capital Ratio
Current Assets/Current Liabilities
$1.1 trillion / $653 billion = 1.75
A working capital ratio of 1.75 indicates a sound liquidity position. Quiñenco should not have problems meeting its near term obligations.
Price to Book Ratio
Current Share Price/Book Value per Share.
$1618.5 / $4670.5 = .35
Quiñenco has a book value per share of $4670.5. At the current market price this implies a price to book ratio of .35, meaning the company’s stock currently trades at a significant discount to the book value of the company.
Quiñenco Stock – Summary and Conclusions
Quiñenco is a beast. They have major investments, and are major players in several huge asset classes. They have a truly global presence and are very well diversified. They appear to be in decent financial health and return capital to shareholders via a dividend.
However the size and scope of the company require much more research before drawing any conclusions.
Investors can consider some of the company’s subsidiaries individually, such as Compañía Cervecerías Unidas SA or CSAV, which I have already analyzed. But without a much more detailed analysis of Quiñenco’s other subsidiaries, I can’t make an investment decision.
Disclaimer
This is not investment advice. Nothing in this analysis should be construed as a recommendation to buy, sell, or otherwise take action related to the security discussed. If I own a position in the security discussed, I will clearly state it.
This is not intended to be a comprehensive analysis and you should not make an investment decision based solely on the information in this analysis. I hope this serves as a useful starting point for a more comprehensive analysis, and hopefully draws attention to aspects of the company that were overlooked or merit further investigation. This is by no means intended to be a complete analysis. Again, this is not investment advice, do your own research.