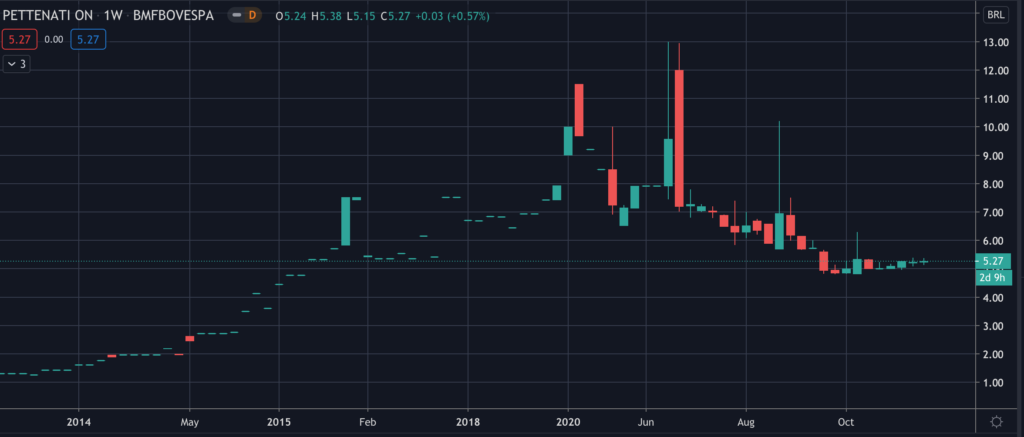
Common Stock: Pettenati (PTNT3)
Current Market Price: R$ 5.27
Market Capitalization: R$ 249.8 million
*All values in this article are expressed in Brazilian Reais (BRL) unless otherwise noted.
**The bulk of this analysis is based on the company’s most recent audited financial report.
Pettenati Stock – Summary of the Company
Pettenati is a Brazilian textile manufacturer. Their main products are finished clothing products and knitwear, which they produce using a wide range of fabrics such as cotton, polyamide, and polyester, among others. They have two factories, one in Brazil and one in El Salvador, and they employ 921 people. Pettenati was founded in 1964 and is headquartered in the state of Rio Grande do Sul, Brazil.

Revenue and Cost Analysis
For the fiscal year end June 2020 Pettenati had revenue of R$ 473.9 million, a significant decrease compared to R$ 547.8 million in the previous period. Their COGS for 2020 was R$ 425.1 million, representing a gross margin of 10%, also a decrease compared to 14.6% in the previous year.
Pettenati has been profitable in each of the last three years, however margins have deteriorated significantly. In 2020 the company had net income of R$ 4 million, representing a profit margin of less than 1%, a significant decrease compared to 6.9% and 6.4% in the previous two years.
Balance Sheet Analysis
Pettenati has a decent but leveraged balance sheet. They have a solid base of assets and sufficient liquidity, however they have relatively high liability levels, including debt.
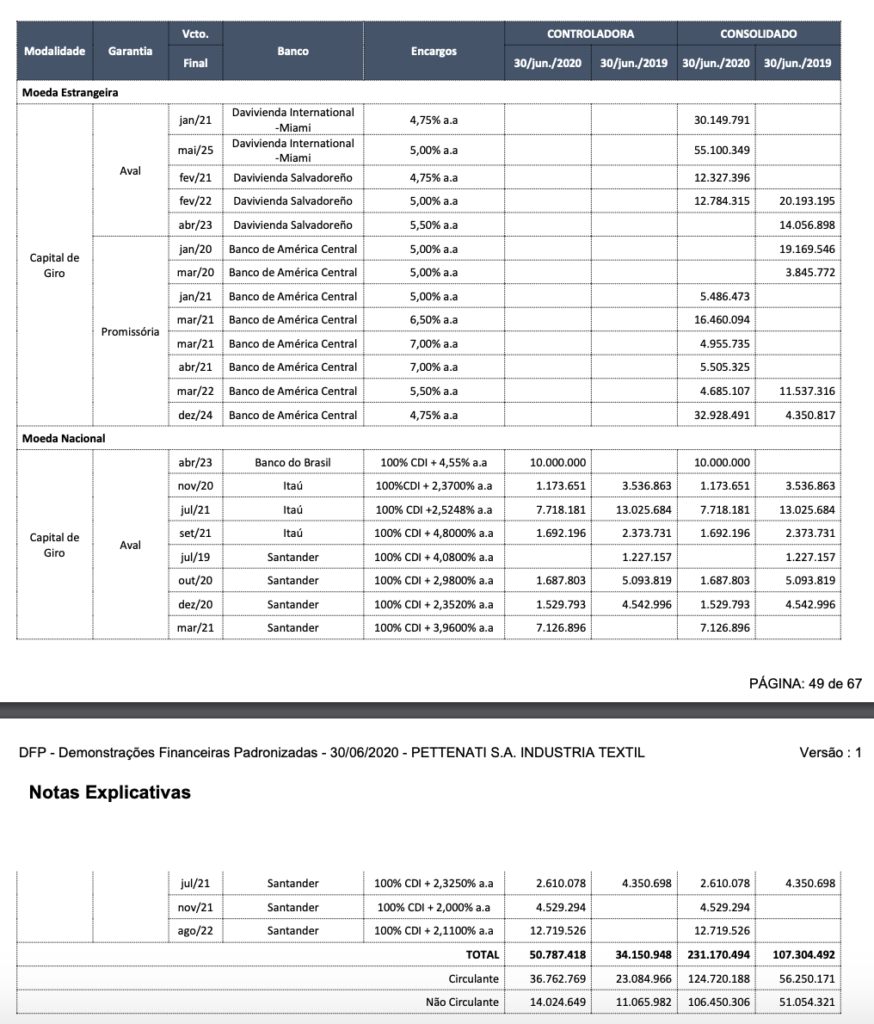
Pettenati – Debt Analysis
As of June 2020 Pettenati has R$ 231.1 million in total debt outstanding, R$ 124.7 million of which is classified as current. R$ 180.5 million of this debt is denominated in foreign currency, exposing the company to the negative effects of a depreciating Brazilian Real.
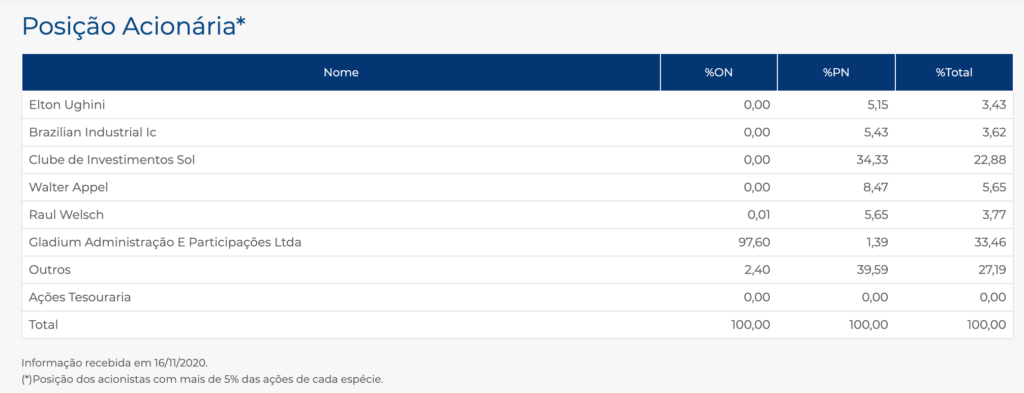
Pettenati Stock – Share Dynamics and Capital Structure
As of June 2020 Pettenati has 16 million common shares outstanding and 32 million preferred shares outstanding. Total shares outstanding is around 48 million. Insiders and institutional investors own around 73% of the company, with the remaining 23% being held by shareholders with an ownership stake of less than 5%.
Pettenati Stock – Dividends
The company has not paid a dividend based on 2020’s results, however they paid total dividends of R$ 0.177 cents per share based on 2019’s results.
Pettenati Stock – 3 Metrics to Consider
Debt to Equity Ratio
Total Liabilities/Total Share Holder Equity
R$ 398.5 million / R$ 302.8 million = 1.3
A debt to equity ratio of 1.3 indicates that Pettenati uses a mix of debt and equity in its capital structure, but is leveraged and relies more heavily on debt financing to fund itself.
Working Capital Ratio
Current Assets/Current Liabilities
R$ 330.6 million / R$ 267.7 million = 1.2
A working capital ratio of 1.2 indicates a sufficient, but not strong liquidity position. Pettenati should not have a problem meeting its near term obligations.
Price to Book Ratio
Current Share Price/Book Value per Share.
R$ 5.71 / R$ 6.30 = .84
Based on total shares outstanding Pettenati has a book value per share of R$ 6.30. At the current market price this implies a price to book ratio of .84, meaning Pettenati stock currently trades at a slight discount to the book value of the company.
Pettenati Stock – Summary and Conclusions
Pettenati is a decent company that has historically performed well. Their 2020 results were negatively impacted by corona virus shutdowns, but in past years they have been profitable with decent margins. However the company’s financial position is not strong as they have significant debt denominated in foreign currency. I don’t see anything exceptional about Pettenati stock that would compel me to invest, especially since I don’t like Brazilian companies exposed to the USD/BRL carry trade. If I had to invest in a Brazilian textile company I would favor a company like Dohler, that has a more conservative financial position.
Disclaimer
This is not investment advice. Nothing in this analysis should be construed as a recommendation to buy, sell, or otherwise take action related to the security discussed. If I own a position in the security discussed, I will clearly state it.
This is not intended to be a comprehensive analysis and you should not make an investment decision based solely on the information in this analysis. I hope this serves as a useful starting point for a more comprehensive analysis, and hopefully draws attention to aspects of the company that were overlooked or merit further investigation. This is by no means intended to be a complete analysis. Again, this is not investment advice, do your own research.