Common Stock: Nexa Resources (NYSE: NEXA)
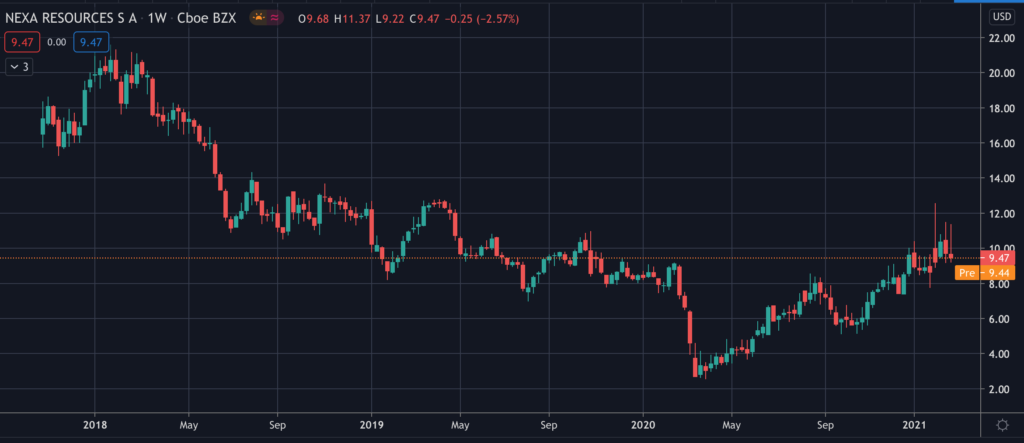
Current Market Price: $9.47 USD
Market Capitalization: $1.25 Billion USD
**Note: All values in this article are expressed in United States Dollars (USD) unless otherwise noted.
Nexa Resources Stock – Summary of the Company
Nexa Resources is a base metals mining and smelting company. They own three operating mines in Peru and two operating mines in Brazil, with a third under construction. In addition they own one zinc smelter in Peru and two in Brazil. The company’s main product is zinc, but they produce relevant amounts of copper, silver, gold, and lead as a byproduct. Nexa Resources was founded in 2017 and is headquartered in Luxembourg.
Revenue and Cost Analysis
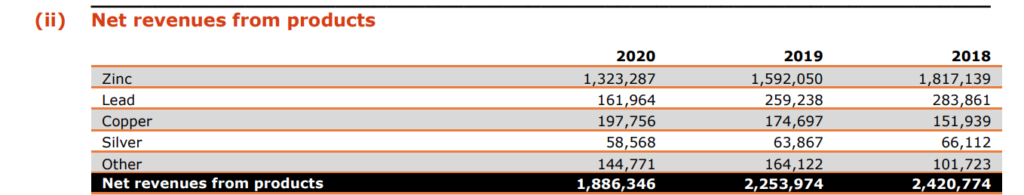
Nexa Resources had revenue of $1.95 billion in 2020, a significant decrease compared to $2.33 billion in 2019. Their COGS was $1.56 billion in 2020, representing a gross margin of 19.8%, an improvement compared to 16.4% the previous year.
The company is not profitable and had a net loss in both 2020 and 2019. In 2020 Nexa Resources had a net loss of $652.5 million, an increase compared to $157.5 million in 2018.
Nexa Resources – Royalty and Streaming Agreements
The company’s most recent financials do not mention any royalty or streaming agreements.
Balance Sheet Analysis
Nexa has a decent balance sheet. They have a solid base of long term assets and sufficient near term liquidity. However they are leveraged with high liability and debt levels.
It is worth noting the company uses derivatives to hedge currency and commodity price exposures. Investors should analyze this derivatives book in detail before investing.
Nexa Resources – Debt Analysis
As of year-end 2020 the company has $2 billion in total debt outstanding, $146 million of which is classified as current.
Nexa Resources Stock – Share Dynamics and Capital Structure
As of year-end 2020 the company has 132.4 million common shares outstanding. The company’s largest shareholder is the Brazilian company Votorantim, who owns 64.3% of Nexa Resources shares.
Nexa Resources Stock – Dividends
In 2020 the company paid total dividends of $0.377 cents per share. At the current market price this implies a dividend yield of 4%.
Nexa Resources Stock – 3 Metrics to Consider
Debt to Equity Ratio
Total Liabilities/Total Share Holder Equity
$3.4 billion / $1.6 billion = 2.1
A debt to equity ratio of 2.1 indicates that Nexa is leveraged and relies heavily on debt financing to fund itself.
Working Capital Ratio
Current Assets/Current Liabilities
$1.7 billion / $876.5 million = 2
A working capital ratio of 2 indicates a sufficient liquidity position. Nexa should not have problems meeting its near term obligations.
Price to Book Ratio
Current Share Price/Book Value per Share.
$9.47 / $12.24 = .77
Nexa has a book value per share of $12.24. At the current market price this implies a price to book ratio of .77, meaning Nexa Resources stock currently trade at a discount to the book value of the company.
Nexa Resources Stock – Summary and Conclusions
Nexa Resources is a decent zinc mining investment. They have a diversified mine portfolio in Peru and Brazil, and a smelting business. However they company is in poor financial health. They are not profitable and have significant amounts of debt outstanding.
I am not currently interested in zinc investments. I would prefer to allocate to precious metals mining companies, such as Calibre Mining.
Disclaimer
This is not investment advice. Nothing in this analysis should be construed as a recommendation to buy, sell, or otherwise take action related to the security discussed. If I own a position in the security discussed, I will clearly state it.
This is not intended to be a comprehensive analysis and you should not make an investment decision based solely on the information in this analysis. I hope this serves as a useful starting point for a more comprehensive analysis, and hopefully draws attention to aspects of the company that were overlooked or merit further investigation. This is by no means intended to be a complete analysis. Again, this is not investment advice, do your own research.