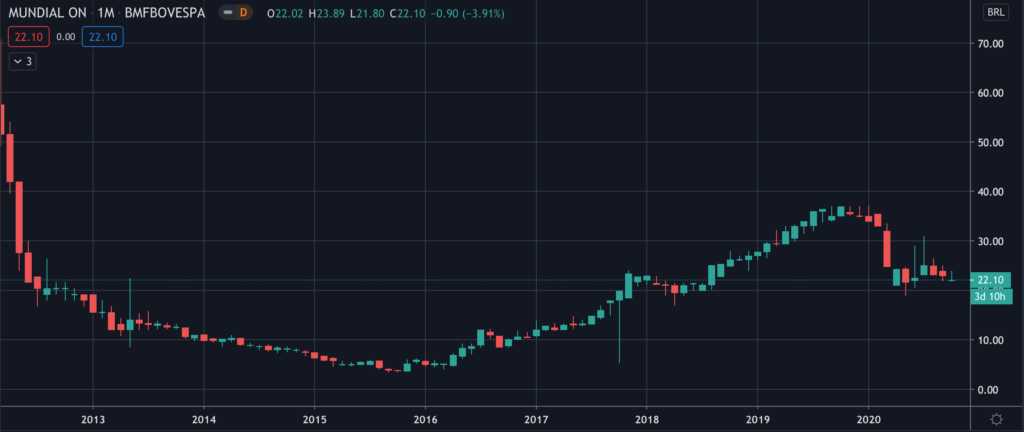
Common Stock: Mundial SA (MNDL3)
Current Market Price: R$ 22.10
Market Capitalization: R$ 54.8 million
*All values in this article are expressed in Brazilian Reais (BRL) unless otherwise noted.
**The bulk of this analysis is based on the company’s most recent audited financial report, which can be found by following this link.
Mundial SA Stock – Summary of the Company
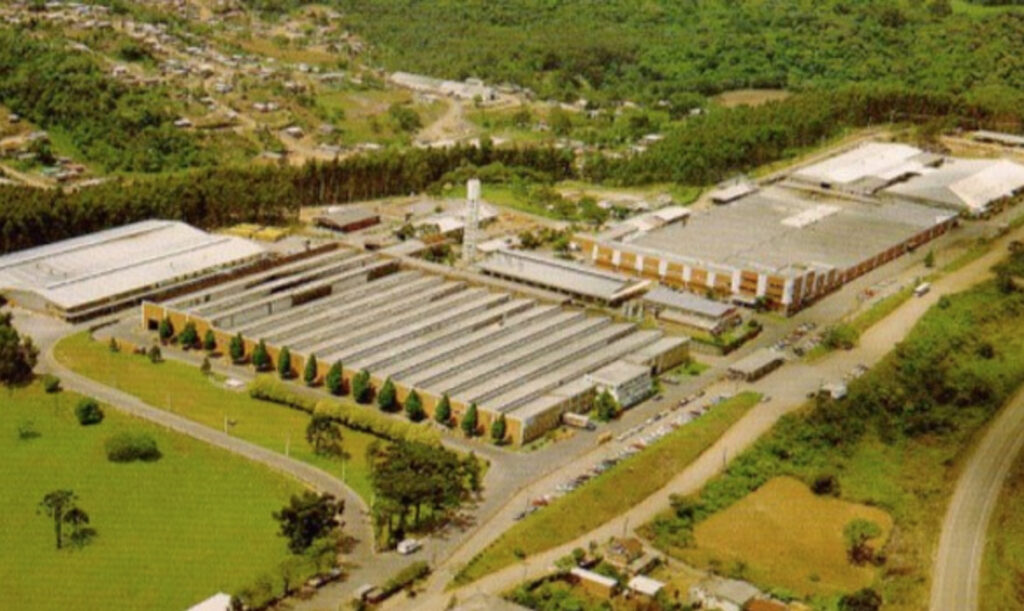
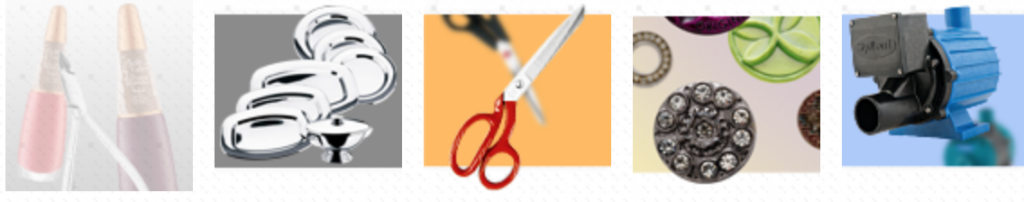
Mundial is a Brazilian consumer goods manufacturing company. They produce a wide range of products including cutlery, scissors, clothespins, buttons, and tweezers, among others. The company’s products are sold throughout Brazil and exported to 35 countries. Mundial was originally founded in 1896 and in 2003 merged with another manufacturer to form the company as it is constituted today. The company is headquartered in Sao Paulo, Brazil and has two additional manufacturing facilities in the state of Rio Grande do Sul.
Revenue and Cost Analysis
Mundial had total revenue of R$ 485.9 million in 2019, an increase from R$ 470 million in 2018. Their COGS was R$322 million in 2019, representing a gross margin of 34%, equal to their gross margin in 2018.
In 2019 Mundial had a net loss of R$ 10.3 million, a significant deterioration compared to a profit of R$ 3 million in 2018. This deterioration can be attributed to higher financing expenses and significantly lower financial income.
Balance Sheet Analysis
Mundial has a weak balance sheet. Their liquidity position is poor, they have high liability levels, including debt, that exceed their asset base.
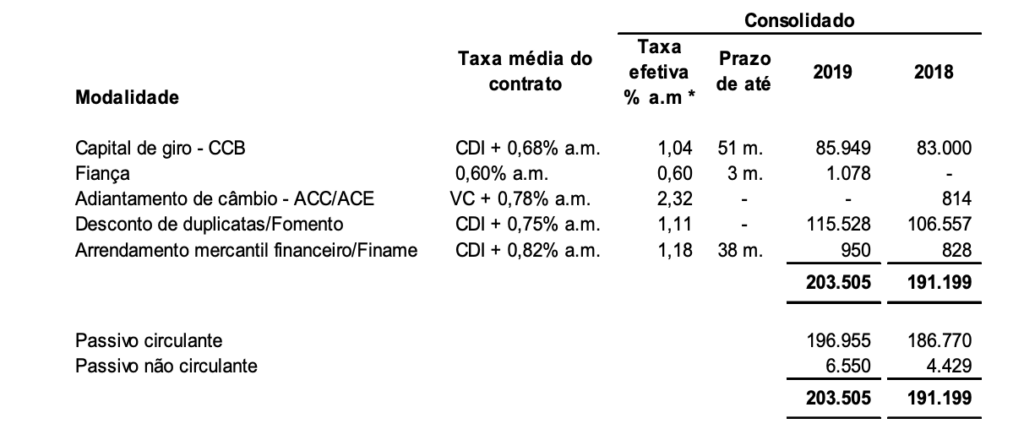
Mundial SA – Debt Analysis
As of year-end 2019 Mundial has R$ 203.5 million in total debt outstanding, R$ 197 million of which is classified as current.
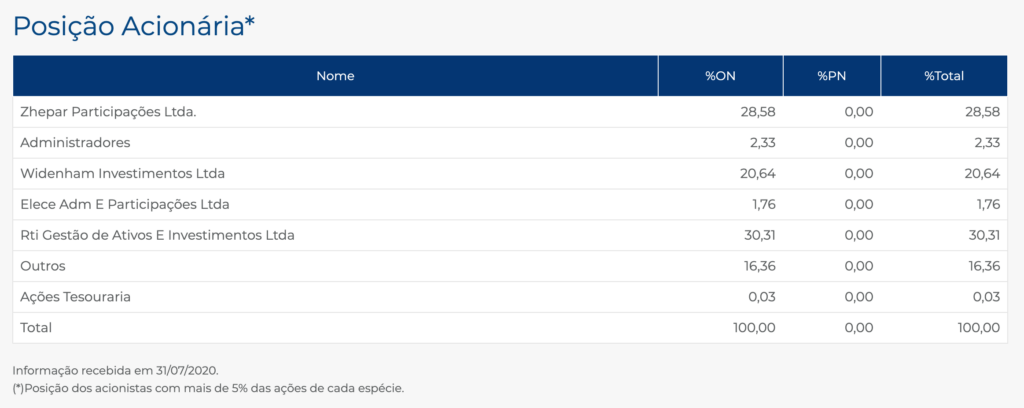
Mundial SA Stock – Share Dynamics and Capital Structure
As of year-end 2019 the company has 2.48 million common shares outstanding. The majority of the company’s shares are held by insiders and several institutional investors. 16.3% of the company’s outstanding shares are held by investors with an ownership stake of less than 5%.
Mundial SA Stock – Dividends
The company did not pay a dividend in either 2018 or 2019.
Mundial SA Stock – 2 Metrics to Consider
Debt to Equity Ratio
Total Liabilities/Total Share Holder Equity
R$ 1.2 billion / -R$ 145.3 million = -8.1
A debt to equity ratio of negative 8.1 indicates that Mundial has accumulated losses and has significantly more liabilities than shareholder equity. The company faces the possibility of insolvency and investors should carefully analyze the company’s liabilities before investing.
Working Capital Ratio
Current Assets/Current Liabilities
R$ 261.5 million / R$ 903.3 million = .29
A working capital ratio of .29 indicates a weak liquidity position. Mundial may have problems meeting its near term obligations. Investors should carefully analyze the company’s liabilities before investing.
Mundial SA Stock – Summary and Conclusions
Mundial is an intriguing company. It has a long history and a strong presence throughout Brazil, as well as internationally. They manufacturer a wide range of products. Their 2019 sales and operating results are decent. However, like many of the Brazilian manufacturing company I have analyzed, Mundial stock is currently uninvestable due to their poor financial health. They have very high liability levels, particularly debt, which has been and will continue to be a significant drag on the company’s results.
Since most of the company’s debt is classified as current in 2019, I will revisit Mundial stock when their 2020 results are available, to see if and how they resolve their debt issue. For now, if I had to invest in a Brazilian manufacturing company, I would prefer a company like Dohler, which is healthier financially and has a more conservative balance sheet.
Disclaimer
This is not investment advice. Nothing in this analysis should be construed as a recommendation to buy, sell, or otherwise take action related to the security discussed. If I own a position in the security discussed, I will clearly state it.
This is not intended to be a comprehensive analysis and you should not make an investment decision based solely on the information in this analysis. I hope this serves as a useful starting point for a more comprehensive analysis, and hopefully draws attention to aspects of the company that were overlooked or merit further investigation. This is by no means intended to be a complete analysis. Again, this is not investment advice, do your own research.