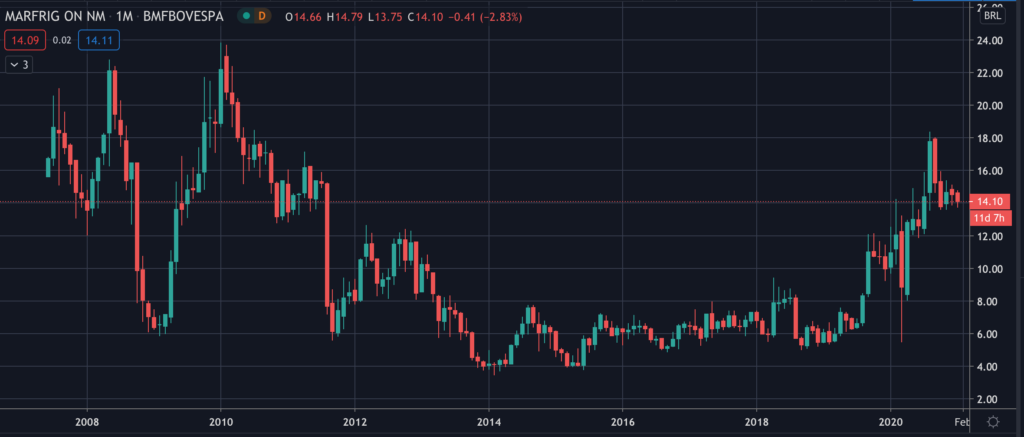
Common Stock: Marfrig (MRFG3) OTC:MRRTY
Current Market Price: R$ 14.10
Market Capitalization: R$ 10 billion
*All values in this article are expressed in Brazilian Reais (BRL) unless otherwise noted.
**The bulk of this analysis is based on the company’s most recent audited financial report, which can be found by following this link.
Summary of the Company
Marfrig is a Brazilian food company focused mainly on beef products. In addition to beef products the company offers a variety of other products, such as frozen vegetables, lamb, fish, sauces, and deserts.
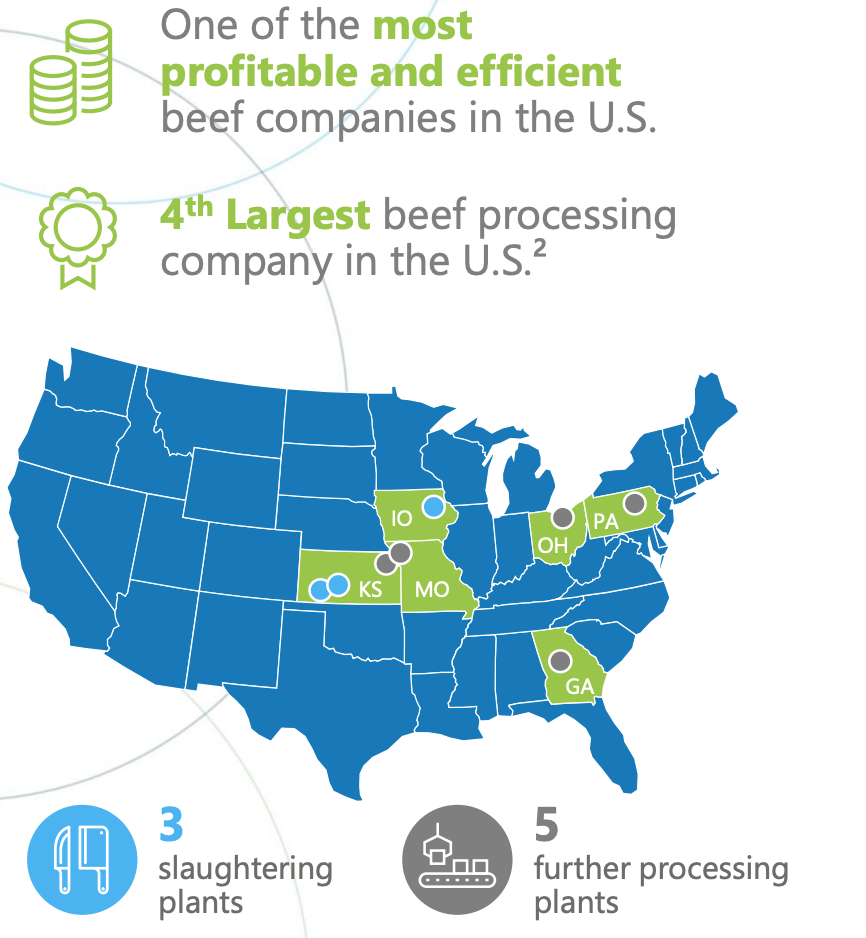
They are the world’s second largest beef company in terms of production capacity, and the fourth largest beef processor in The United States (14% market share). Marfrig is the largest beef exporter to Chile, the largest hamburger producer in Argentina, and the largest beef producer in Uruguay. Sufficed to say Marfrig is a global beef powerhouse.
The company has 33 production units distributed throughout South America, North America, Asia, and Europe. They export to over 100 countries and currently employee around 32,000 people globally.
Their operations are split through 2 business structures: North America and South America.
- North America– Slaughtering capatity of 13,100 heads of cattle per day. They distribute their products through 3 distinct channels; retail, wholesale, and food services. Marfrig is the leading US exporter of beef to Japan and South Korea. In addition the North American operation has the production capacity for 106,000 tons of beef patties annually.
- South America – Slaughtering capacity of 18,000 heads of cattle per day. The South American unit distributes its products through 2 channels; retail and food services.
Marfrig was founded in 2000 and is headquartered in Sao Paulo, Brazil. The company had its IPO in Brazil in 2007. They used the capital raised to acquire additional beef processing plants In Brazil.

Market Overview
Global Beef Market
–The global beef market had an estimated value of $332.5 billion USD in 2020. North America accounted for over 30% of total market revenue in 2017. The global beef market is expected to have a CAGR (compound annual growth rate) of 3.1% over the next 5 years.
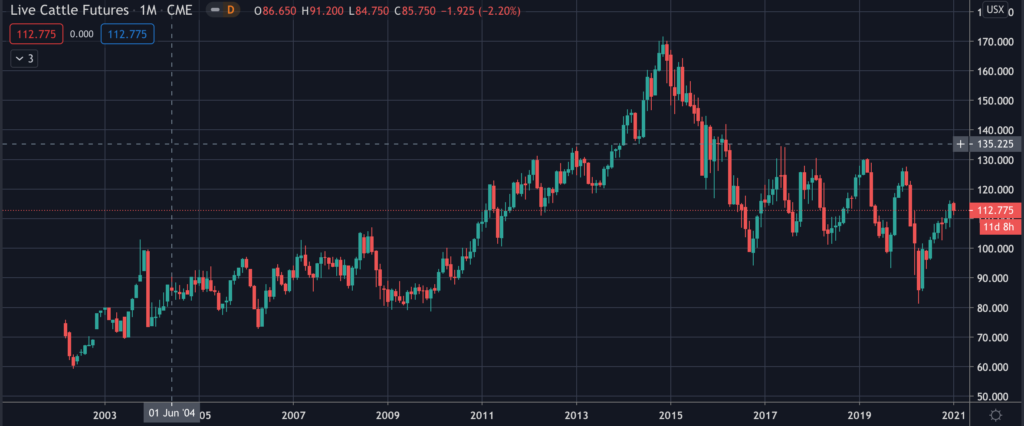
-Live Cattle prices have been relatively stable and currently trade around their 4 years monthly moving average. This means Marfrig’s input costs have been stable over the past several years.
Marfrig’s Key Markets
-Marfrig is the largest beef producer in Uruguay. This may not seem like a big deal, but Uruguay is a global beef powerhouse. This little country with a population of just over 3 million has the 10th largest cattle heard in the world, with over 11 million heads of cattle. They also consume the most beef per capita in the world!
-Marfrig is the largest beef exporter to Chile. Chile is a globally relevant beef market, ranking 10th in the world in term of per capita consumption.
-Marfrig accounts for around 20% of Brazil’s beef exports. The country has the 2nd largest cattle heard in the world after India, with over 244 million heads of cattle. They also rank 5th in per capita beef consumption.
-Marfrig is the largest beef patty producer in Argentina. Argentina is a key global beef market, with the 6th largest cattle heard in the world. They are 2nd globally in terms of per capita consumption.
-Marfrig is a leading beef exporter to China. China ranks 2nd globally in absolute beef consumption, only trailing behind the United States. This market presents significant growth opportunities for Marfrig moving forward, as per capita consumption is still relatively low, ranking 46th in the world in terms of per capita consumption.
Financial Performance
Revenue and Cost Analysis
Marfrig had total revenue of R$ 48.7 billion in 2019, a significant increase compared to R$ 29.7 billion in 2018. However a large part of this increase is due to significant depreciation in the Brazilian Real against the US dollar. The company’s COGS was R$ 42.3 billion in 2019, representing a gross margin of 13%, equal to their gross margin in 2018.
The company was profitable in 2019 with net income of R$ 1.5 billion, representing a profit margin of 3.2%. This was a significant decrease compared to a profit margin of 7.2% in 2018.
Although cattle costs have remained relatively stable , beef prices increased slightly in 2019, resulting in margin expansion for Marfrig. The company’s “cutout ratio” (Average beef price/ Average cattle cost) improved 5.2% compared to 2018, going from 1.81 in 2018 to 1.9 in 2019. Unfortunately for the company, this margin improvement was overshadowed by the significant depreciation of the Brazilian Real vs the Us Dollar.
Recent Acquisitions
–In 2019 Marfrig acquired Quickfood, the largest beef products company in Argentina, owning some of Argentina’s most well-known meat brands. Marfrig acquired 92% of Quickfood’s outstanding shares for a total acquisition expense of around $55 million USD.
–In 2019 Marfrig acquired a majority stake (51%) in Iowa Premium for $76.5 million USD. This increased their production capacity in North America by 1,100 heads per day.
–In 2018 Marfrig acquired a majority stake (51%) in National Beef for $969 million USD. This added two production facilities in North America and increased the company’s capacity by 12,000 heads of cattle per day (13% of total US capacity at the time of acquisition). In 2019 they increased their ownership position to 81.7%.
Balance Sheet Analysis
Marfrig has a decent but highly leveraged balance sheet. They have a solid base of physical assets such as property plant and equipment, as well as a sufficient liquidity position. However a significant portion of the company’s assets are intangible and they have high liability levels, including debt.
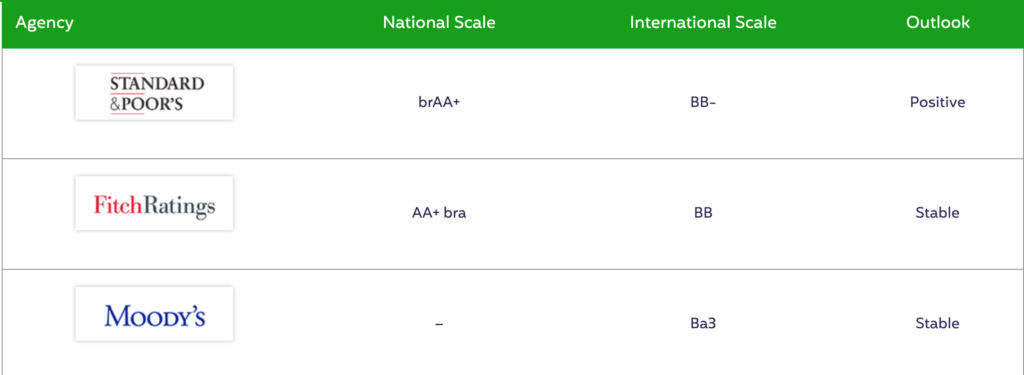
Fitch, Moody’s and S&P have all rated Marfrig’s debt as below investment grade.
It is worth noting that Marfrig uses derivatives (futures) to hedge commodity price risk. Investors should analyze the company’s derivative book in detail before investing.
Marfrig – Debt Analysis
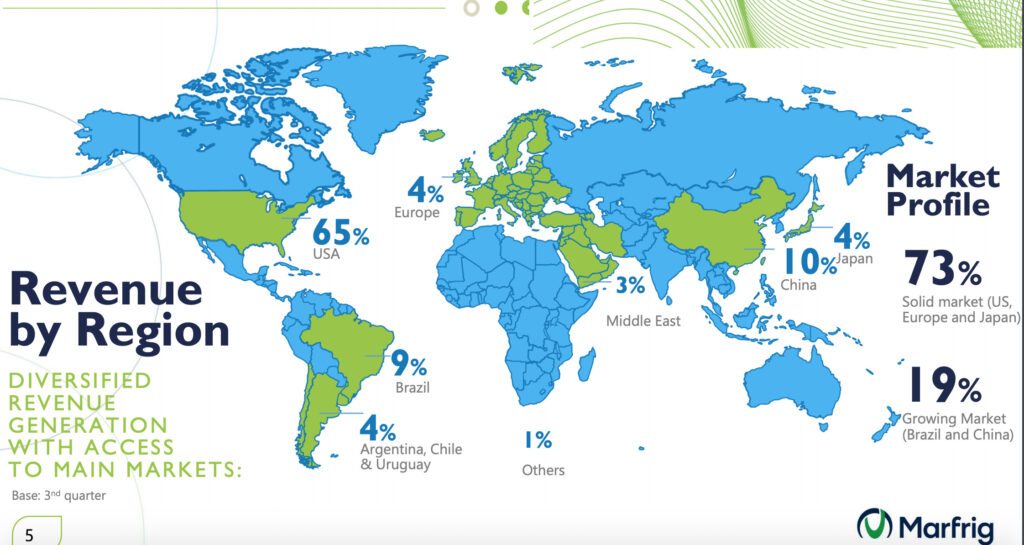
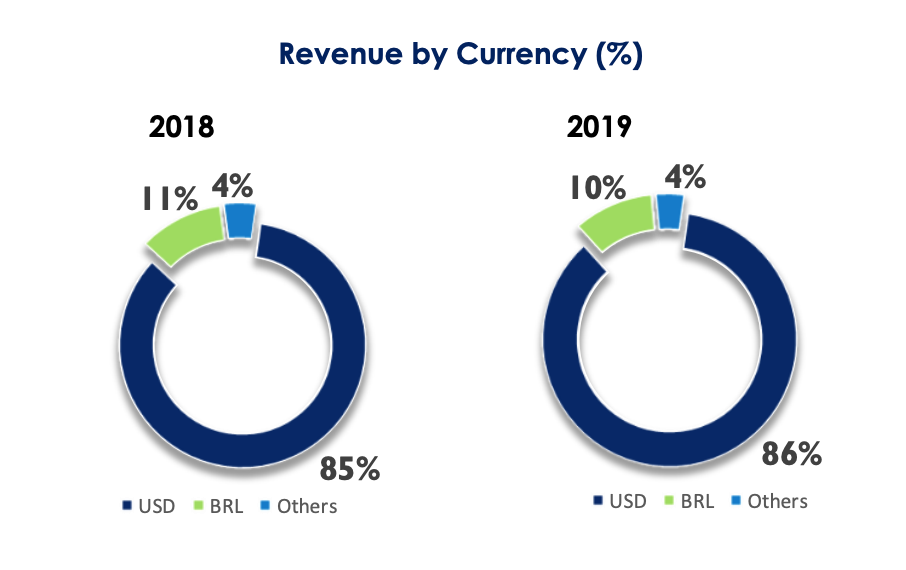
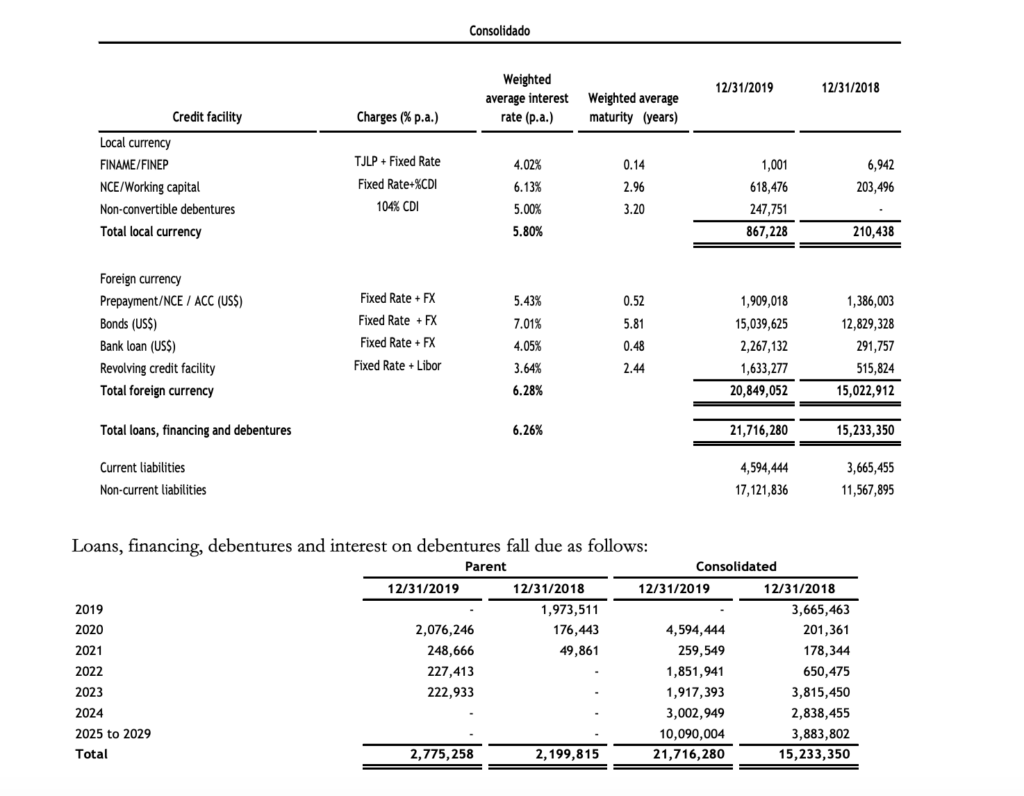
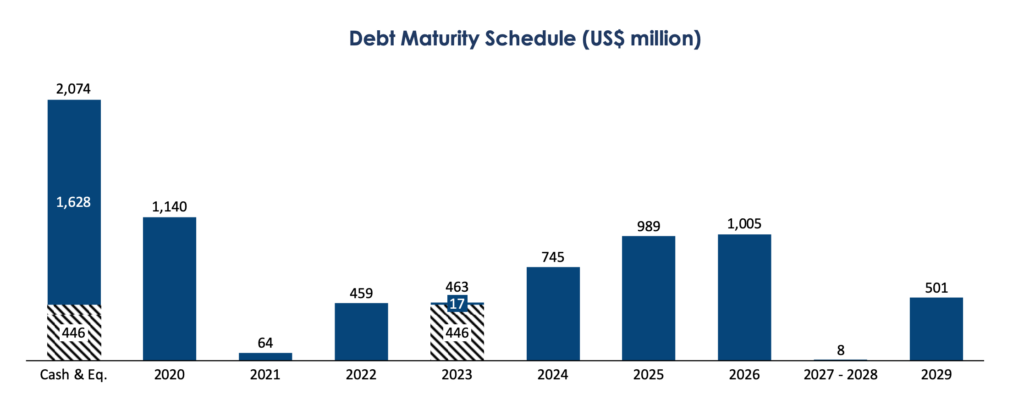
As of year-end 2019, Marfrig has total debt outstanding of R$ 21.7 billion, R$ 4.6 billion of which is classified as current. 96% of the company’s debt is denominated in foreign currency, however this does not concern me as the company has a natural hedge given that 90% of their revenue is also denominated in foreign currency.
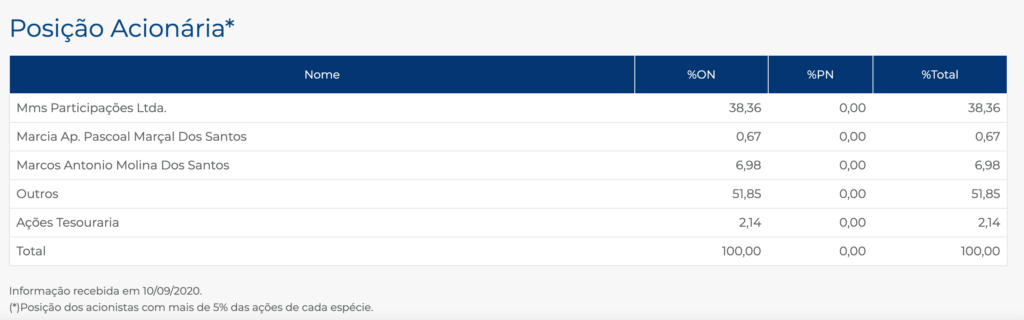
Marfrig Stock – Share Dynamics and Capital Structure
As of year-end 2019 Marfrig has 711.3 million common shares outstanding, 90.1 million of these shares were issued in December 2019. The company’s treasury, insiders and one institutional investor own around 48% of the company’s outstanding shares, with the remaining 52% being held by shareholders with a position of less than 5%.
Marfrig Stock – Dividends
The company does not currently pay a dividend.
Marfrig Stock – 4 Metrics to Consider
Debt to Equity Ratio
Total Liabilities/Total Share Holder Equity
R$ 29.7 billion / R$ 1.8 billion = 16.7
A debt to equity ratio of 16.7 indicates that Marfrig is highly leveraged and uses large amounts of debt financing in its capital structure. The company may be dependent on further debt financing in the future.
Working Capital Ratio
Current Assets/Current Liabilities
R$ 14.4 billion / R$ 10.6 billion = 1.4
A working capital ratio of 1.4 indicates a sufficient but not strong liquidity position. Marfrig should not have problems meeting its near term obligations.
Price to Book Ratio
Current Share Price/Book Value per Share.
R$ 14.10 / R$ 2.50 = 5.7
Marfrig has a book value per share of R$ 2.50. At the current market price this implies a price to book ratio of 5.7, meaning the company’s stock currently trades at a significant premium to the book value of the company.
Price/ Operating Cash Flow
Current Share Price / Operating Cash Flow per Share
R$ 14.10 / R$ 3.65 = 3.9
Marfrig has operating cash flows per share of R$ 3.65. At the current market price this implies a price to operating cash flow ratio of 3.9, meaning investors are currently paying R$ 3.90 per R$ 1.00 of operating cashflow. It is worth noting the company is highly leveraged and this ratio excludes financing costs, so free cash flow per share is significantly less than R$ 3.65 per share generated by the company’s operations.
Marfrig Stock – Summary and Conclusions
Positives
-Marfrig is the second largest meat company in the world, present in over 100 countries. They continue to expand in key markets such as The United States and China. Marfrig owns the largest number of plants (13) in South America authorized to export to China, making the company well positioned to capture some of China’s potential growth.
-The company has diversified production capacity. With over 33 plants spread out globally, meaning Marfrig is not overly dependent on any one plant or jurisdiction.
-Marfrig is a market leader in several key global beef markets such as Brazil, Uruguay, Argentina, Chile, The United States, and China
The company has decent liquidity position and is profitable. Operating Margins expanded in 2019 due in part to an improved “cutout ratio”, however this was overshadowed by a depreciating Brazilian Real.
Negatives
-Marfrig has high debt levels, including foreign currency denominated debt. However the majority of the company’s revenue is in US Dollars, so they have a natural hedge to their foreign currency exposure.
-I don’t understand the company’s investment into “meat alternatives”. This is an unproven market and no plant based meat company has proven profitable over any relevant period of time. The best outcome I can see here is the company profitably cannibalizes some of its meat sales, which I don’t believe is an attractive prospect from an investors point of view. I would much rather see management focus on their core business, which has plenty of potential for growth.
-Increasing global tariffs (“trade wars”) have the potential to negatively impact Marfrig and reduce its margins on exports.
Conclusion
I like the business, but I don’t like its share price and balance sheet. Personally, I am not a buyer of Marfrig stock at its current price. I will continue to monitor Marfrig stock and would reconsider investing if the company’s debt position improves significantly or if the share price drops significantly. However that doesn’t mean Marfrig stock isn’t a solid opportunity for certain investors with different time horizons, risk tolerance, or other exposures in their portfolio that Marfrig stock may help hedge. As always this is not investment advice, do your own due diligence.
I think there are plenty of other compelling Latin American food stocks, that may present a better risk/reward for investors currently.
If you would like to learn more about LATAM investment opportunities subscribe to this newsletter, its free! You can also connect with me on LinkedIn or follow me on Twitter.
Disclaimer
This is not investment advice. Nothing in this analysis should be construed as a recommendation to buy, sell, or otherwise take action related to the security discussed. If I own a position in the security discussed, I will clearly state it.
This is not intended to be a comprehensive analysis and you should not make an investment decision based solely on the information in this analysis. I hope this serves as a useful starting point for a more comprehensive analysis, and hopefully draws attention to aspects of the company that were overlooked or merit further investigation. This is by no means intended to be a complete analysis. Again, this is not investment advice, do your own research.