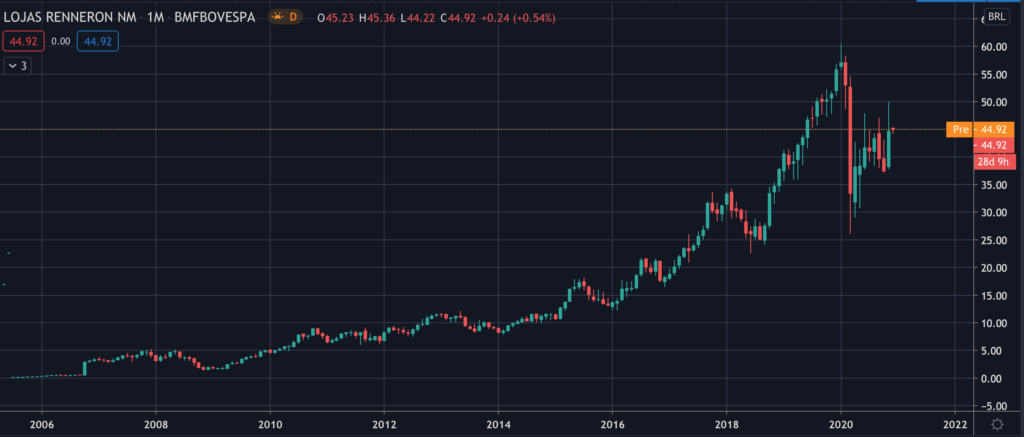
Common Stock: Lojas Renner (LREN3)
Current Market Price: R$ 42.92
Market Capitalization: R$ 34.2 billion
*All values in this article are expressed in Brazilian Reais (BRL) unless otherwise noted.
**The bulk of this analysis is based on the company’s most recent audited financial report, which can be found by following this link.
Lojas Renner Stock – Summary of the Company
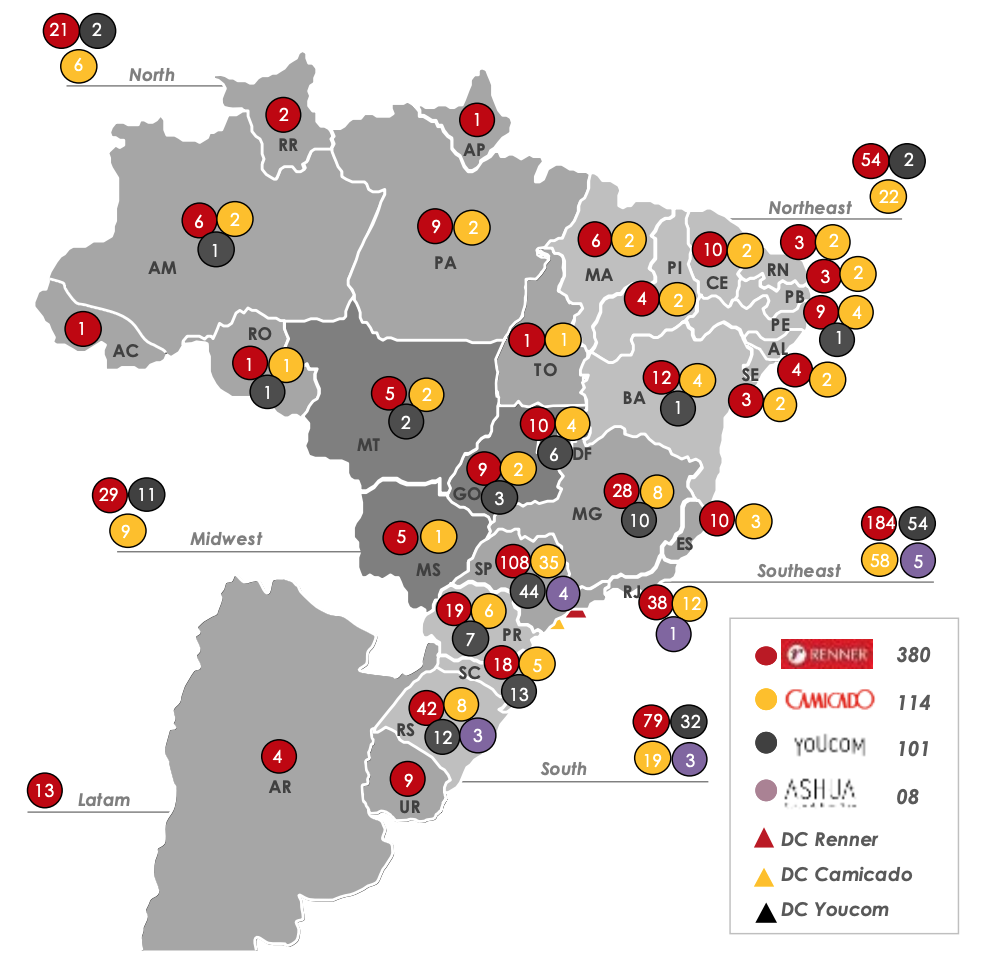
Lojas Renner is the largest fashion retailer in Brazil. Their 4 store brands include Renner, Camicado, Youcom, and Ashua, all of which sell a range of proprietary clothing and apparel brands. They have a total of 590 stores located throughout Brazil and an additional 13 stores in Argentina and Uruguay. 52 of these stores were opened in 2019. In addition they have 3 distribution centers in Brazil.
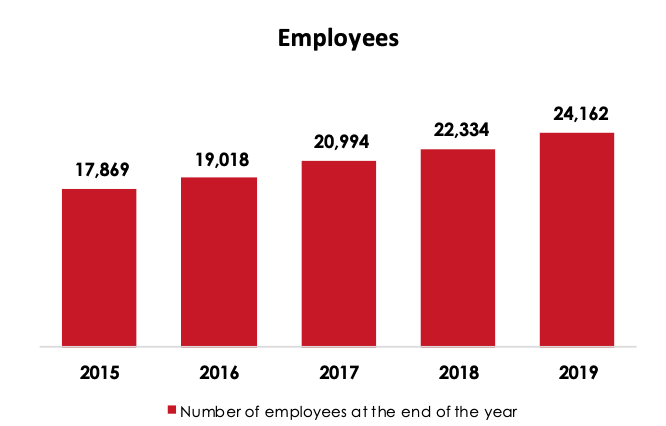
Renner also has a financial arm which is focused on providing credit to the company’s customers, mainly through the Renner credit card. As of year end 2019 the company has issued a total of 32.5 million cards. The company continues to invest its e-commerce business and as of year-end 2019 the Renner app has 2.3 million active users. Lojas Renner was founded in 1965 and is headquartered in Porto Alegre, Brazil. They currently employ around 24,100 people.
Revenue and Cost Analysis
Renner had net revenue of R$ 9.6 billion in 2019, a significant increase from R$ 8.4 billion in 2018. Their COGS was R$ 3.7 billion in 2019, representing a gross margin of 61%, equal to their gross margin in 2018.
The company was profitable in each of the last two years. In 2019 Renner had net income of R$ 1.1 billion, representing a profit margin of 11.5%, on par with their margin of 12.1% in 2018.
Balance Sheet Analysis
Renner has a decent, but leveraged balance sheet. Their liquidity position is sufficient in the near term and they have a solid base of long term assets. However they are leveraged and have relatively high liability levels, including lease and debt obligations.
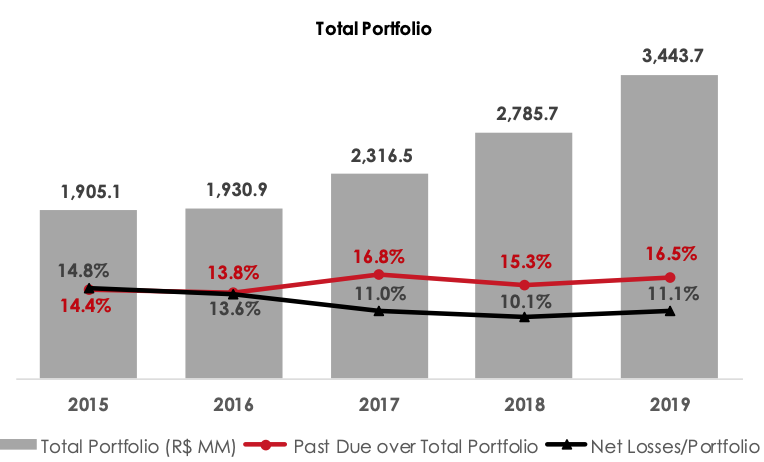
The company’s credit portfolio grew to R$ 3,4 billion in 2019, a significant increase from R$2.8 billion in 2018. 16.5% of this portfolio is classified as past due as of year-end 2019, also an increase from 15.3% in 2018.
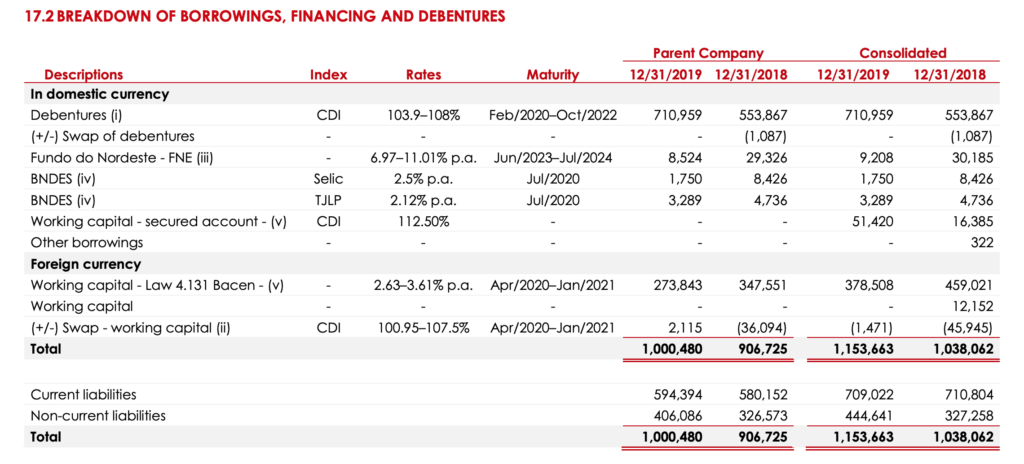
Lojas Renner – Debt Analysis
As of year-end 2019 Renner has total debt outstanding (not including lease obligations) of R$ 1.2 billion, R$ 709 million of which is classified as current.
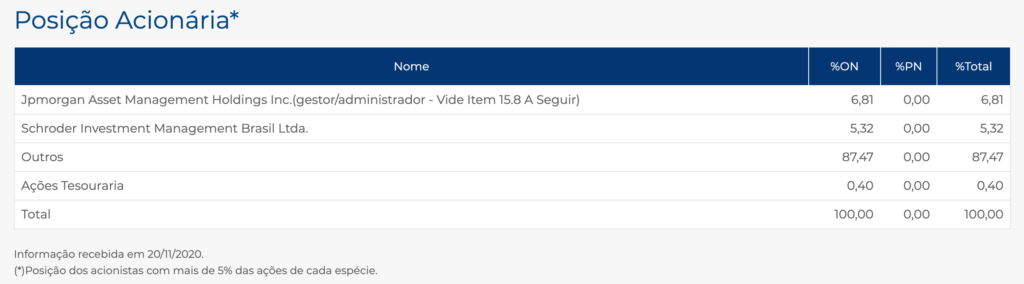
Lojas Renner Stock – Share Dynamics and Capital Structure
As of November 2020 Renner has 796.2 million common shares outstanding. Institutional investors and the company’s treasury own around 13% of the outstanding shares, with the remaining 87% being held by smaller shareholders with a position of less than 5%.
Lojas Renner Stock – Dividends
Based on 2019’s results Renner paid total dividends of R$ 0.70 cents per share. At the current market price this implies a dividend yield of 1.6%.
In addition, in April 2019 Renner shareholders approved a one-time special stock dividend, granting existing shareholder 1 new share of stock for every 10 they owned.
Lojas Renner Stock – 3 Metrics to Consider
Debt to Equity Ratio
Total Liabilities/Total Share Holder Equity
R$ 7.1 billion / R$ 4.7 billion = 1.5
A debt to equity ratio of 1.5 indicates that Renner uses a mix of debt and equity in its capital structure, but is leveraged, and relies more heavily on debt financing to fund itself.
Working Capital Ratio
Current Assets/Current Liabilities
R$ 6.7 billion / R$ 4.8 billion = 1.4
A working capital ratio of 1.4 indicates a sufficient, but not strong liquidity position. Renner should not have a problem meeting its near term obligations.
Price to Book Ratio
Current Share Price/Book Value per Share.
R$ 42.92 / R$ 5.91 = 7.3
Lojas Renner has a book value per share of R$ 5.91. At the current market price this implies a price to book ratio of 7.3, meaning Lojas Renner stock currently trades at a significant premium to the book value of the company.
Lojas Renner Stock – Summary and Conclusions
Renner is a solid company. They are already the largest fashion retailer in Brazil, and continue to grow domestically. In addition the have begun to expand internationally, starting with Uruguay and Argentina. Their e-commerce business is growing and already has 2.3 million active users, and their credit business has already issued 32.5 million credit cards.
The company is in decent financial health with sufficient liquidity and assets on its balance sheet, in addition to being profitable in both 2018 and 2019. However the company was likely impacted heavily by the coronavirus crisis. Many of its stores were forced to close for a time and deterioration in the financial health of the Brazilian consumer likely lead to increased past due credit.
Due to the potential lingering effects of the crisis and the fact that the company’s current valuation Is by no means cheap,I will wait to see Renner’s 2020 financials before making an investment decision. If the company was able to maintain a relatively healthy financial position and continue to grow its e-commerce business, then I will seriously consider taking a position in Lojas Renner stock. I will be comparing Lojas Renner stock to other Brazilian retailers such as Grazziotin.
Disclaimer
This is not investment advice. Nothing in this analysis should be construed as a recommendation to buy, sell, or otherwise take action related to the security discussed. If I own a position in the security discussed, I will clearly state it.
This is not intended to be a comprehensive analysis and you should not make an investment decision based solely on the information in this analysis. I hope this serves as a useful starting point for a more comprehensive analysis, and hopefully draws attention to aspects of the company that were overlooked or merit further investigation. This is by no means intended to be a complete analysis. Again, this is not investment advice, do your own research.