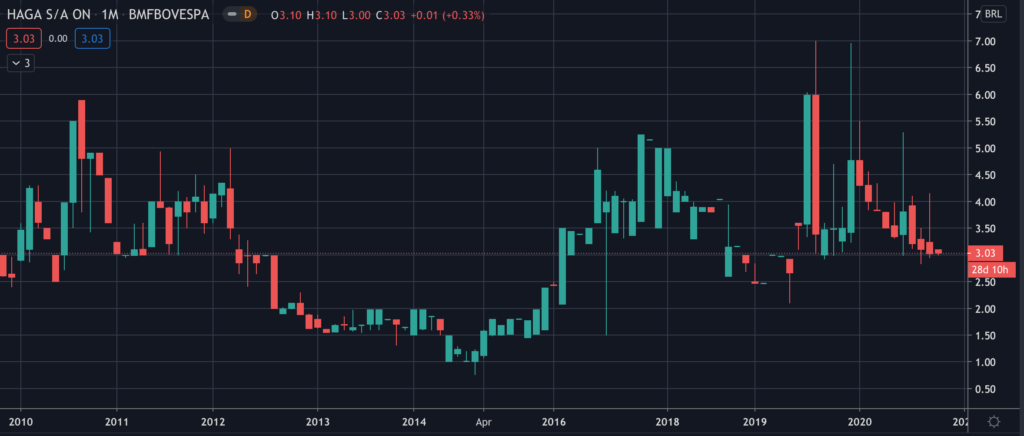
Common Stock: Haga (HAGA3)
Current Market Price: R$ 3.03
Market Capitalization: R$ 36 million
*All values in this article are expressed in Brazilian Reais (BRL) unless otherwise noted.
**The bulk of this analysis is based on the company’s most recent audited financial report, which can be found by following this link.
Haga Stock – Summary of the Company
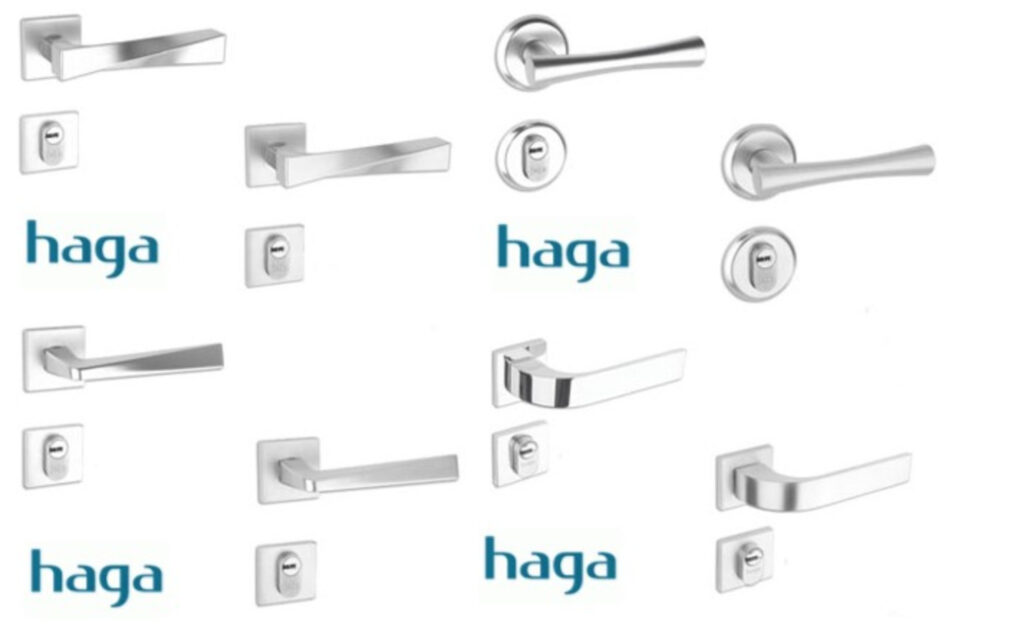
Haga is a Brazilian metal products manufacturer. Their main products are locks, hinges, and other hardware for construction. Haga has total manufacturing facilities with around 20,000 square meters of space, giving them the ability to produce four million items per year. Haga was founded in 1937 and is headquartered in Rio de Janeiro Brazil.
Revenue and Cost Analysis
Haga has had relatively stable revenue over the past several years. Total revenue was R$ 23.5 million in 2019, a slight increase from R$ 22.9 million in 2018. The company had COGS of R$ 18.4 million in 2019, representing a gross margin of 22%, also a slight increase compared to 2018’s gross margin of 19%.
Haga was profitable in each of the last two years. Net income was R$ 2.5 million in 2019, representing a profit margin of 11%.
Balance Sheet Analysis
Haga has a weak balance sheet. Although liquidity appears sufficient in the short term, the company has excessive long term liabilities that are nearly double the company’s total assets. The composition of these long term liabilities is not clear, as the company lists the majority of them as “other liabilities” with little explanation.
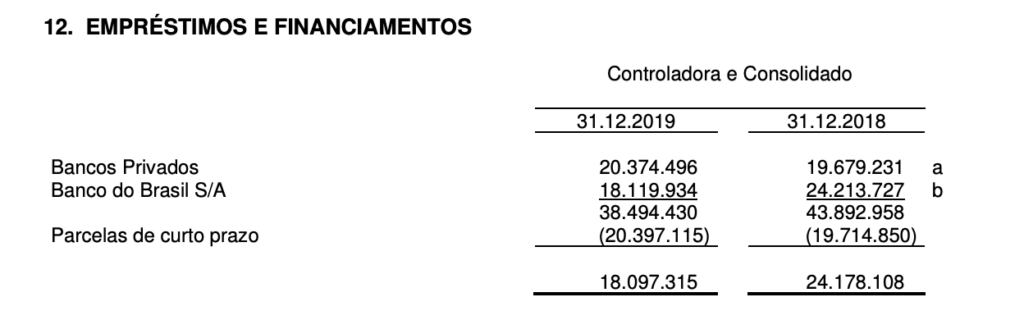
Haga – Debt Analysis
As of year-end 2019 the company has R$ 38.5 million in total debt outstanding, of which R$ 20.4 million is classified as current.
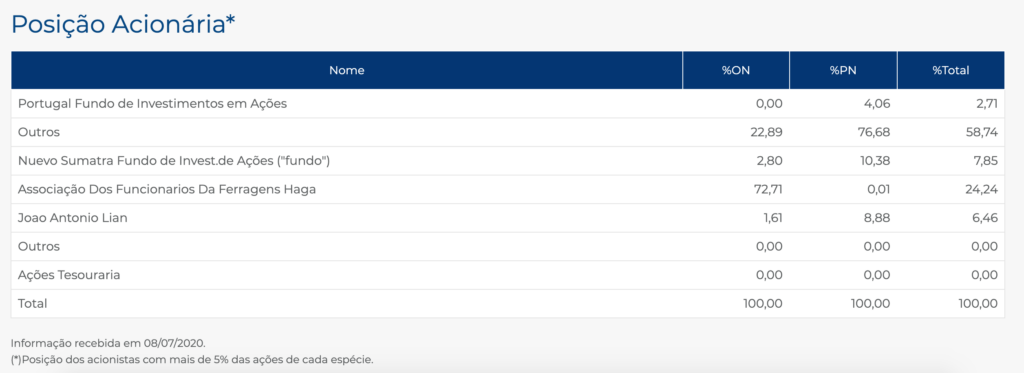
Haga Stock – Share Dynamics and Capital Structure
As of year-end 2019 the company has around 4 million common shares outstanding and 7.9 million preferred shares outstanding. Total shares outstanding is 11.9 million. Haga’s largest single shareholder is its workers association.
Haga Stock – Dividends
The company did not pay a dividend in 2019.
Haga Stock – 2 Metrics to Consider
Debt to Equity Ratio
Total Liabilities/Total Share Holder Equity
R$ 131.7 million / -R$ 75.5 million = -1.75
A debt to equity ratio of negative 1.75 indicates that Haga has accumulated losses and has significantly more liabilities than shareholder equity. The company faces the possibility of insolvency and investors should carefully analyze the company’s liabilities before investing.
It is worth noting that most of these accumulated losses causing negative shareholder equity were accumulated prior to 2008, so the company is not in as poor financial condition as this metric may imply.
Working Capital Ratio
Current Assets/Current Liabilities
R$ 45.2 million / R$ 23.4 million = 1.9
A working capital ratio of 1.9 indicates a sufficient but not strong liquidity position. Haga should not have problems meeting its near term obligations.
Haga Stock – Summary and Conclusions
Haga is a solid company with over 80 years of history. They have been profitable for the past two years and being that the employees are the largest shareholders, interests with investors are reasonably aligned.
However the company’s balance sheet is too weak for me to invest. The company has very high liability levels relative to its operations, including high debt levels. Furthermore I was unable to adequately understand the company’s long term liabilities due to low quality financial disclosures.
Although Haga stock may appear cheap by some metrics, I don’t see any catalyst for a significant increase in valuation, so I expect it to stay cheap. If I were going to allocate to Brazilian manufacturers I would rank a company like Dohler above Haga.
Disclaimer
This is not investment advice. Nothing in this analysis should be construed as a recommendation to buy, sell, or otherwise take action related to the security discussed. If I own a position in the security discussed, I will clearly state it.
This is not intended to be a comprehensive analysis and you should not make an investment decision based solely on the information in this analysis. I hope this serves as a useful starting point for a more comprehensive analysis, and hopefully draws attention to aspects of the company that were overlooked or merit further investigation. This is by no means intended to be a complete analysis. Again, this is not investment advice, do your own research.