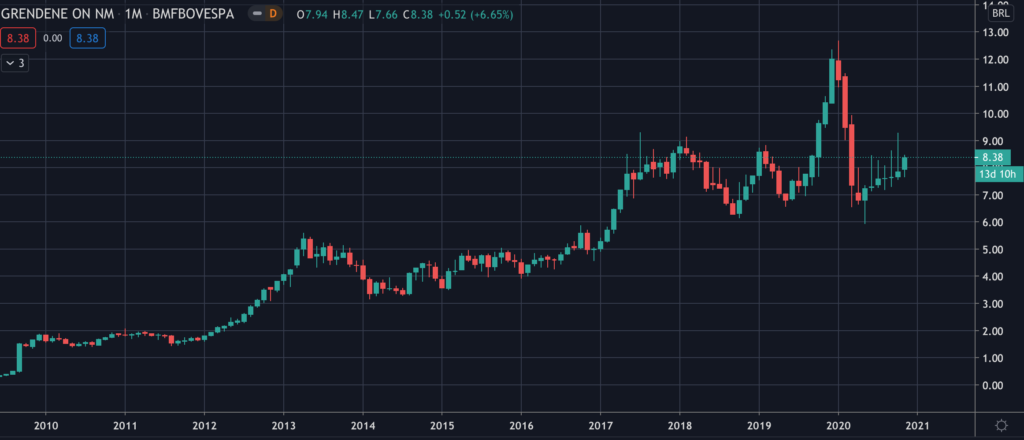
Common Stock: Grendene (GRND3)
Current Market Price: R$ 8.38
Market Capitalization: R$ 7.5 Billion
*All values in this article are expressed in Brazilian Reais (BRL) unless otherwise noted.
**The bulk of this analysis is based on the company’s most recent audited financial report, which can be found by following this link.
Grendene Stock – Summary of the Company
Grendene is a Brazilian footwear and apparel manufacturer and retailer. They have 5 factories, all located in Brazil and 746 stores globally. Grendene sells its products through 7 unique brands. The company is present throughout all of Brazil as well as The United States, Italy, and The United Kingdom. Grendene was founded in 1971 and is headquartered in the state of Ceara Brazil. They employee around 18.800 people.

Revenue and Cost Analysis
Grendene had revenue of R$ 2 billion in 2019, a decrease from R$ 2.3 billion in 2018 and R$ 2.2 billion in 2017. In 2019 their COGS was R$ 1.1 billion, representing a gross margin of 45.6%, also a slight decrease compared to 47% an 49% in 2018 and 2017 respectively.
The company has been profitable for each of the past 3 years. Grendene had net income of R$ 495 million in 2019 representing a profit margin of 23.8%, which is a decrease compared to 25% and 29.3% in 2018 and 2017 respectively.
Around 25% of the company’s revenue in 2019 was derived from sales outside of Brazil, with the remaining 75% being domestic sales.
Balance Sheet Analysis
Grendene has a strong balance sheet. They have a very strong liquidity position and a solid asset base. Liability levels are low relative to the size of their operations and they uses very little leverage.
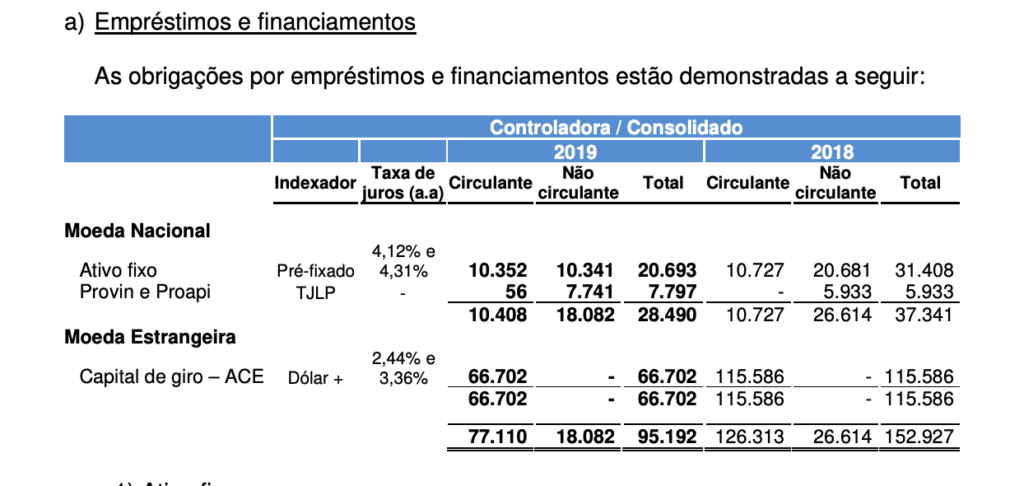
Grendene – Debt Analysis
As of year-end 2019 Grendene has total debt outstanding (excluding lease obligations) of R$ 95.2 million, R$ 28.5 million of which is classified as current. R$ 66.7 million of this debt is denominated in US dollars exposing the company to the negative effects of a depreciating Brazilian Real.
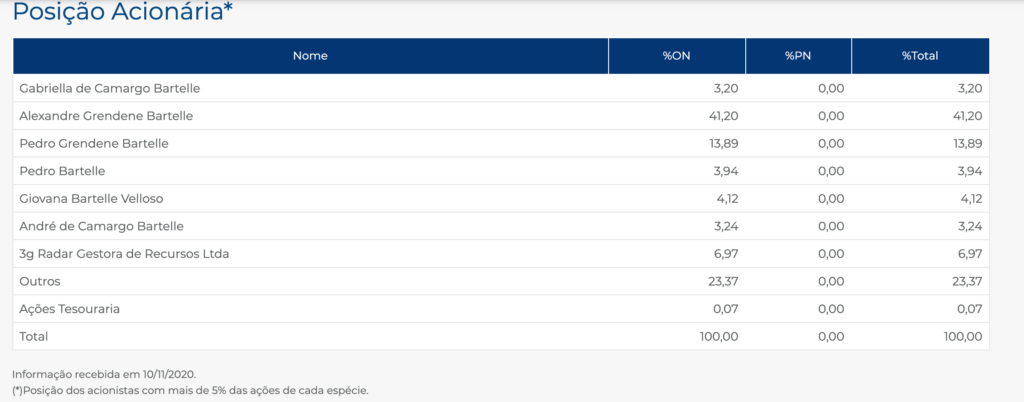
Grendene Stock – Share Dynamics and Capital Structure
As of year-end 2019 Grendene has 902.1 million common share outstanding. Insiders and one institutional investor own around 77% of the company, with the remaining 23% being held by smaller shareholders with an ownership position of less than 5%.
Grendene Stock – Dividends
Grendene paid total dividends of R$ 0.287 cents per share based on 2019’s results. This represents a payout ratio of 53.9% and a the current market price represents a dividend yield of 3.4%.
Grendene Stock – 3 Metrics to Consider
Debt to Equity Ratio
Total Liabilities/Total Share Holder Equity
R$ 382 million / R$ 3.6 billion = .1
A debt to equity ratio of .1 indicates that Grendene uses very little debit in its capital structure and relies mostly on equity financing to fund itself.
Working Capital Ratio
Current Assets/Current Liabilities
R$ 2.6 billion / R$ 298 million = 8.9
A working capital ratio of 8.9 indicates a very strong liquidity position. Grendene should not have a problem meeting its near term obligations.
Price to Book Ratio
Current Share Price/Book Value per Share.
R$ 8.38 / R$ 4.08 = 2
Grendene has a book value per share of R$ 4.08. At the current market price this implies a price to book ratio of 2, meaning Grendene stock currently trades at a premium to the book value of the company.

Grendene Stock – Summary and Conclusions
Grendene is one of the leading footwear companies in Brazil. They have a presence throughout Brazil and relevant revenues internationally. Revenues declined in 2019 compared to 2018 and 2017, however the company is still profitable and in a strong position financially. Their liquidity position is strong and they have a clean balance sheet, with manageable debt levels. The company regularly returns capital to shareholder via a dividend.
I like Grendene stock, the company is sound financially and trades at a reasonable, but certainly not cheap valuation. However the company was surly impacted by the coronavirus shutdowns and a depreciating Brazilian Real . Given that it is already November, I will wait for the company’s 2020 results before making an investment decision. For now I will leave Grendene stock at the top of my watchlist. I will be comparing their 2020 results to other Brazilian footwear companies such as Alpargatas.
Disclaimer
This is not investment advice. Nothing in this analysis should be construed as a recommendation to buy, sell, or otherwise take action related to the security discussed. If I own a position in the security discussed, I will clearly state it.
This is not intended to be a comprehensive analysis and you should not make an investment decision based solely on the information in this analysis. I hope this serves as a useful starting point for a more comprehensive analysis, and hopefully draws attention to aspects of the company that were overlooked or merit further investigation. This is by no means intended to be a complete analysis. Again, this is not investment advice, do your own research.
One Comment
Comments are closed.