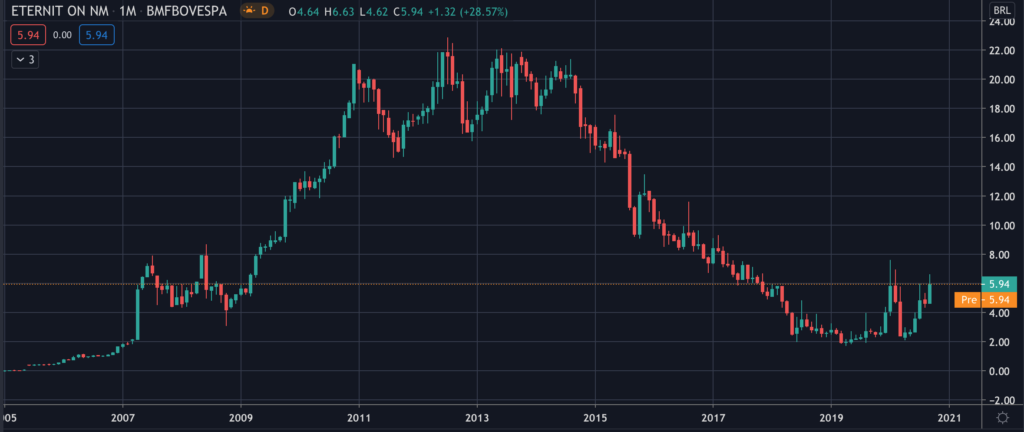
Common Stock: Eternit (ETER3)
Current Market Price: R$ 5.94
Market Capitalization: R$ 307 million
*All values in this article are expressed in Brazilian Reais (BRL) unless otherwise noted.
**The bulk of this analysis is based on the company’s most recent audited financial report, which can be found by following this link.
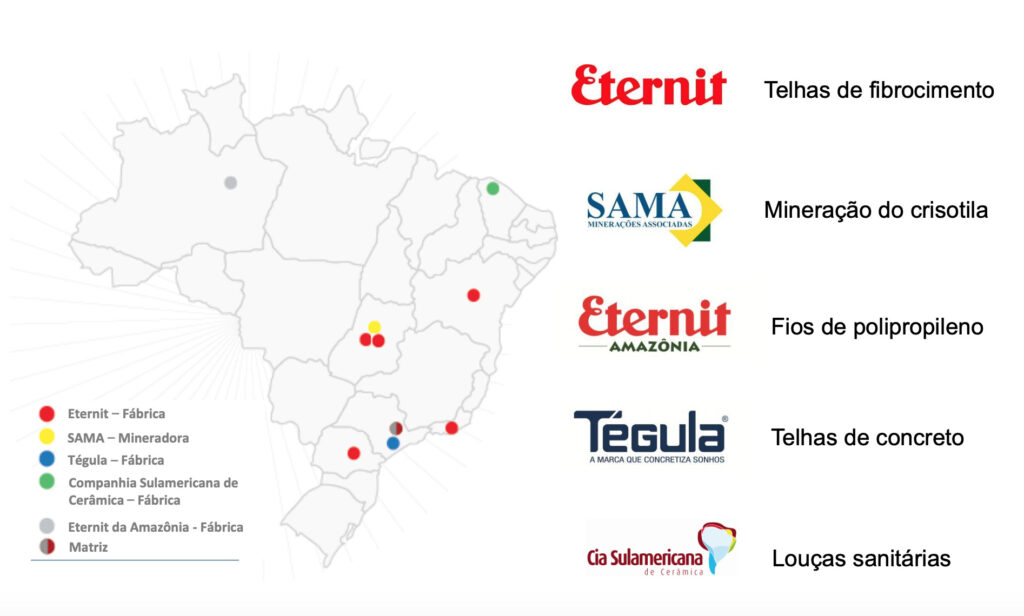
Eternit Stock – Summary of the Company
Eternit is a Brazilian manufacturing company focused on the production and sale of concrete, cement, plastic, and plaster products. The company filed for bankruptcy protection in 2018 and is currently undergoing restructuring. Eternit was founded in 1940 and is headquartered in Sao Paulo, Brazil. They have around 1,800 employees.
Revenue and Cost Analysis
Eternit’s revenue has decline for the past several years. Total sales were R$ 665.7 million in 2017, declining to R$ 488.6 million in 2019. At the same time the company’s COGS have been increasing, causing a contraction in the company’s gross margins. Eternit had a gross margins of 25% in 2017, 19% in 2018, and 14% in 2019.
The company has not been profitable in any of the past 3 years and shareholder equity turned negative in 2019.
Balance Sheet Analysis
Eternit does not have a strong balance sheet. They have significant liabilities, including debt. Their liquidity position is sufficient, but not strong in the near term. They do have a solid base of long term assets, but the return on these assets has been deteriorating over the past several years.
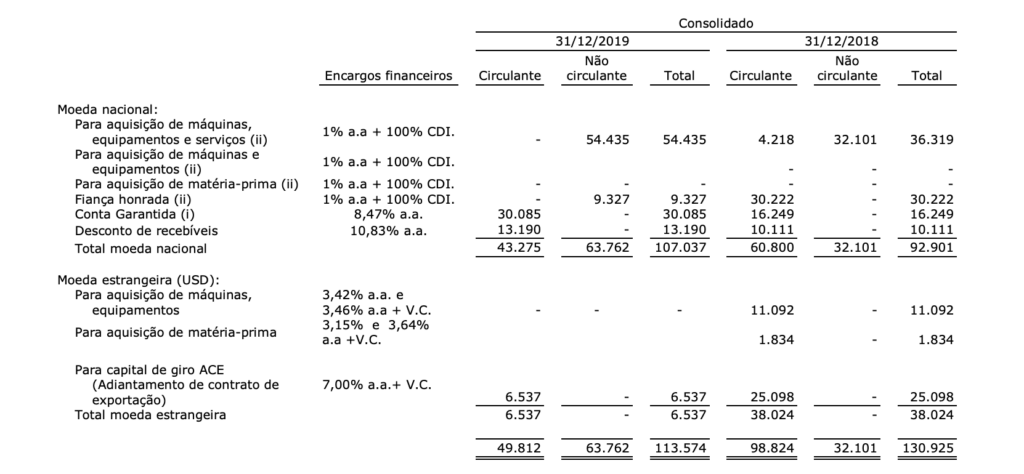
Eternit – Debt Analysis
As of year-end 2019 the company has R$ 113.5 million in total debt outstanding, R$ 49.8 million of which is classified as current. R$ 6.5 millions of this debt, all current, is denominated in US Dollars. The effects of a depreciating Brazilian Real in 2020 are going to be a drag on the company’s 2020 performance, however it appears that after 2020 the company is no longer exposed to the carry trade, as all of their long term debt in denominated it the company domestic currency.
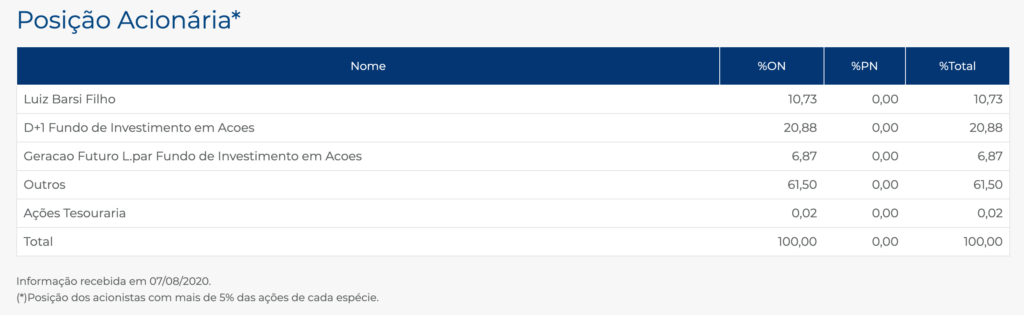
Eternit Stock – Share Dynamics and Capital Structure
As of July 2020, the company has 51.6 million common shares outstanding. Around 62% of the company’s shares are held by investors with less than 5% of the company. The company has two institutional funds and one individual that have significant ownership stakes.
Eternit Stock – Dividends
The company did not pay a dividend in 2018 or 2019.
Eternit Stock – 2 Metrics to Consider
Debt to Equity Ratio
Total Liabilities/Total Share Holder Equity
R$ 548.3 million / -R$ 2.8 million = -197
A debt to equity ratio of negative 197 indicates that Eternit has accumulated losses and has significantly more liabilities than shareholder equity. The company faces the possibility of insolvency and investors should carefully analyze the company’s liabilities before investing.
Working Capital Ratio
Current Assets/Current Liabilities
R$ 232.5 million / R$ 228.5 million = 1
A working capital ratio of 1 indicates a sufficient but not strong short term liquidity position.
Eternit Stock – Summary and Conclusions
Eternit is and has been in, poor financial health. The company recently went through bankruptcy proceedings and although they appear to be better off compared to a few years ago, the company is by no means in a sound financial position.
Debt levels are high and the company has not shown any signs of profitability, in fact operating results have been deteriorating. Based on the company’s financial position, I will not invest in Eternit stock. If I wanted to invest in a Brazilian manufacturer, I would look for a company with much healthier financials, such as Dohler.
Disclaimer
This is not investment advice. Nothing in this analysis should be construed as a recommendation to buy, sell, or otherwise take action related to the security discussed. If I own a position in the security discussed, I will clearly state it.
This is not intended to be a comprehensive analysis and you should not make an investment decision based solely on the information in this analysis. I hope this serves as a useful starting point for a more comprehensive analysis, and hopefully draws attention to aspects of the company that were overlooked or merit further investigation. This is by no means intended to be a complete analysis. Again, this is not investment advice, do your own research.